Georgia S8P2.a
The Standard
- S8P2
- Obtain, evaluate, and communicate information about the law of conservation of energy to develop arguments that energy can transform from one form to another within a system.
Analyze and interpret data to create graphical displays that illustrate the relationships of kinetic energy to mass and speed, and potential energy to mass and height of an object.
Georgia Standards of Excellence for Science · Obtain, evaluate, and communicate information about the law of conservation of energy to develop arguments that energy can transform from one form to another within a system.
Teacher's field guide
What This Standard Means
What Students Need to Do
- Students read tables of mass, speed, height, kinetic energy, and potential energy. They choose useful graphs, plot data accurately, and explain how changing one variable changes energy.
What Mastery Looks Like
- Students hold other variables constant when comparing data. They recognize linear patterns for mass and height and a squared pattern for speed.
Common Misconceptions
- Students often think doubling speed only doubles kinetic energy instead of quadrupling it. They may compare data where several variables change at once. Some put energy on the wrong graph axis or confuse kinetic energy with potential energy.
How to Assess It
- Exit ticket: Graph kinetic energy data (speed, energy): (1,1), (2,4), (3,9), and potential energy data (height, energy): (1,20), (2,40), (3,60). Write one sentence comparing the patterns.
Lesson moves
Ways to Teach It
Use toy cars, washers, a ramp, and phone video to collect mass and speed data, calculate kinetic energy, and make a graph.
Ask students to defend this claim in writing: doubling speed affects kinetic energy more than doubling mass.
Run a graph-matching relay where teams pair data tables with kinetic or potential energy graphs and explain each match.
Give students roller coaster car masses, hill heights, and speeds, then have them graph where kinetic and potential energy are greatest.
Free download
Printable S8P2.a Worksheet
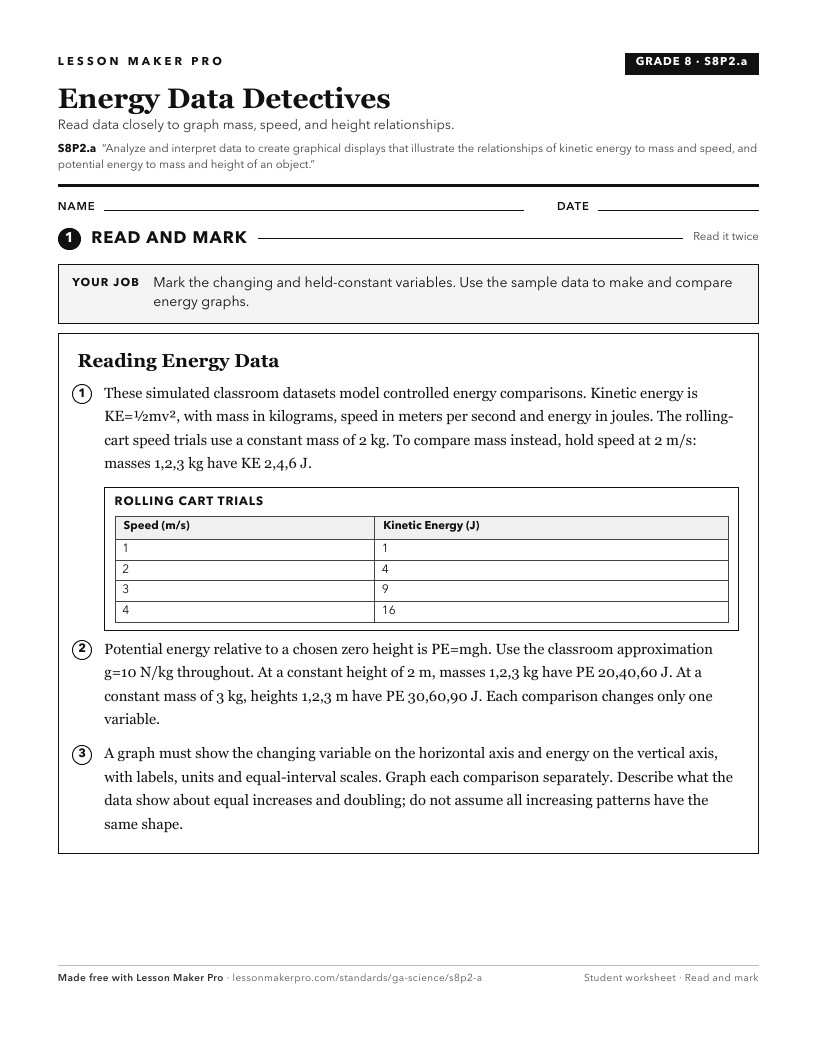
A ready-to-print activity worksheet aligned to S8P2.a, with an answer key for the teacher on its own page. No account needed.
PDF, US Letter, prints cleanly in black and white.
Download the worksheetKeep exploring
Related Standards
- S8P3.a
Analyze and interpret data to identify patterns in the relationships between speed and distance, and velocity and acceleration.
- S6E3.d
Analyze and interpret data to create graphic representations of the causes and effects of waves, currents, and tides in Earth's systems.
- S8P3
Obtain, evaluate, and communicate information about cause and effect relationships between force, mass, and the motion of objects.
- S8P2.b
Plan and carry out an investigation to explain the transformation between kinetic and potential energy within a system (e.g., roller coasters, pendulums, rubber...
Turn this exact standard into a lesson
Grade, subject, topic, and the complete standard are prefilled. Create one free, no account needed.
Also for this standard:Make a WorksheetMake a QuizMake a Sub Lesson