Florida B.E.S.T. MA.912.AR.6.4
The Standard
Given a table, equation or written description of a polynomial function of degree 3 or higher, graph that function and determine its key features.
Florida B.E.S.T. Standards for Mathematics
Teacher's field guide
What This Standard Means
What Students Need to Do
- Students create a graph from a polynomial equation, table, or written situation. They use the graph to identify zeros, intercepts, extrema, end behavior, and intervals of increase or decrease.
What Mastery Looks Like
- Students produce an accurate graph with a useful scale and window. They identify intercepts, relative maxima and minima, end behavior, and intervals where the function increases, decreases, or stays positive or negative.
Common Misconceptions
- Students may treat every zero as a crossing, ignoring even multiplicity. They may reverse end behavior, miss relative extrema, or assume a calculator window shows the whole graph.
How to Assess It
- Give students f(x) = (x + 2)(x - 1)^2(x - 3). Ask them to graph it and label intercepts, turning points, end behavior, and where it increases or decreases.
Lesson moves
Ways to Teach It
Give groups equation, table, graph, and feature cards to match, then require written evidence for each match.
Compare two polynomial graphs and ask, "How do degree, leading coefficient, and multiplicity explain their different shapes?"
Run a feature hunt where pairs graph four polynomials and earn points for correctly locating specified intercepts, extrema, and intervals.
Model an open-top box volume with a cubic function, graph the feasible domain, and identify the dimensions that produce maximum volume.
Free download
Printable MA.912.AR.6.4 Worksheet
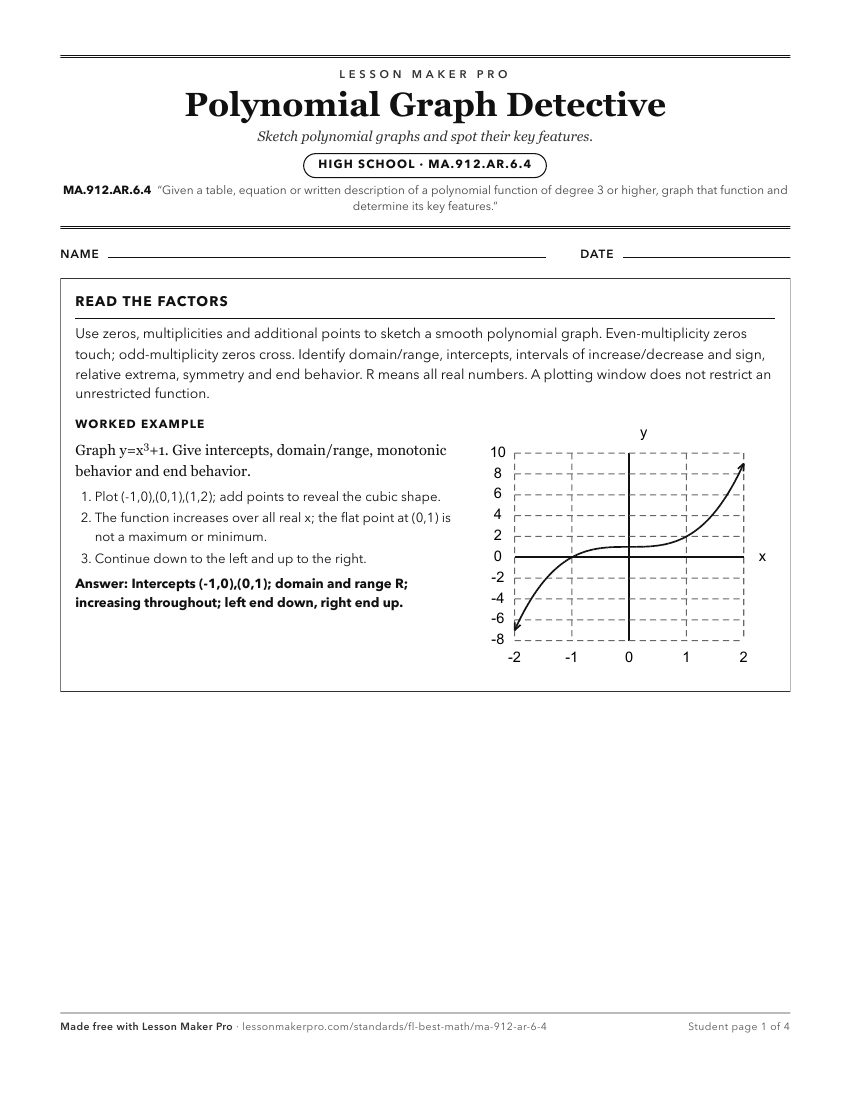
A ready-to-print activity worksheet aligned to MA.912.AR.6.4, with an answer key for the teacher on its own page. No account needed.
PDF, US Letter, prints cleanly in black and white.
Download the worksheetKeep exploring
Related Standards
- MA.912.AR.3.7
Given a table, equation or written description of a quadratic function, graph that function, and determine and interpret its key features.
- MA.912.AR.8.2
Given a table, equation or written description of a rational function, graph that function and determine its key features.
- MA.912.AR.5.6
Given a table, equation or written description of an exponential function, graph that function and determine its key features.
- MA.912.AR.2.4
Given a table, equation or written description of a linear function, graph that function, and determine and interpret its key features.
Turn this exact standard into a lesson
Grade, subject, topic, and the complete standard are prefilled. Create one free, no account needed.
Also for this standard:Make a WorksheetMake a QuizMake a Sub Lesson