Florida B.E.S.T. MA.8.F.1.3
The Standard
Analyze a real-world written description or graphical representation of a functional relationship between two quantities and identify where the function is increasing, decreasing or constant.
Florida B.E.S.T. Standards for Mathematics
Teacher's field guide
What This Standard Means
What Students Need to Do
- Students read a situation or graph and track how the output changes as the input moves from left to right. They identify input intervals where values rise, fall, or stay the same.
What Mastery Looks Like
- Students correctly classify each section of a graph using input intervals. They explain what each section means in the given situation, including what remains unchanged.
Common Misconceptions
- Students may think a graph is increasing whenever it is above the horizontal axis. They may read from right to left or list output values instead of input intervals. Some call a nearly flat section constant even when it rises or falls.
How to Assess It
- Give an exit ticket with segments connecting (0, 2), (3, 8), (5, 8), and (9, 1). Ask students to label each input interval as increasing, decreasing, or constant.
Lesson moves
Ways to Teach It
Build a floor graph with masking tape, then have students walk left to right and label each rising, falling, or flat section.
Show a water tank graph and ask, “What is happening during each interval, and what evidence supports your claim?”
Give pairs graph and story cards to match, then require them to mark increasing, decreasing, and constant input intervals.
Track classroom temperature every ten minutes, graph the data, and identify when temperature rose, fell, or stayed unchanged.
Free download
Printable MA.8.F.1.3 Worksheet
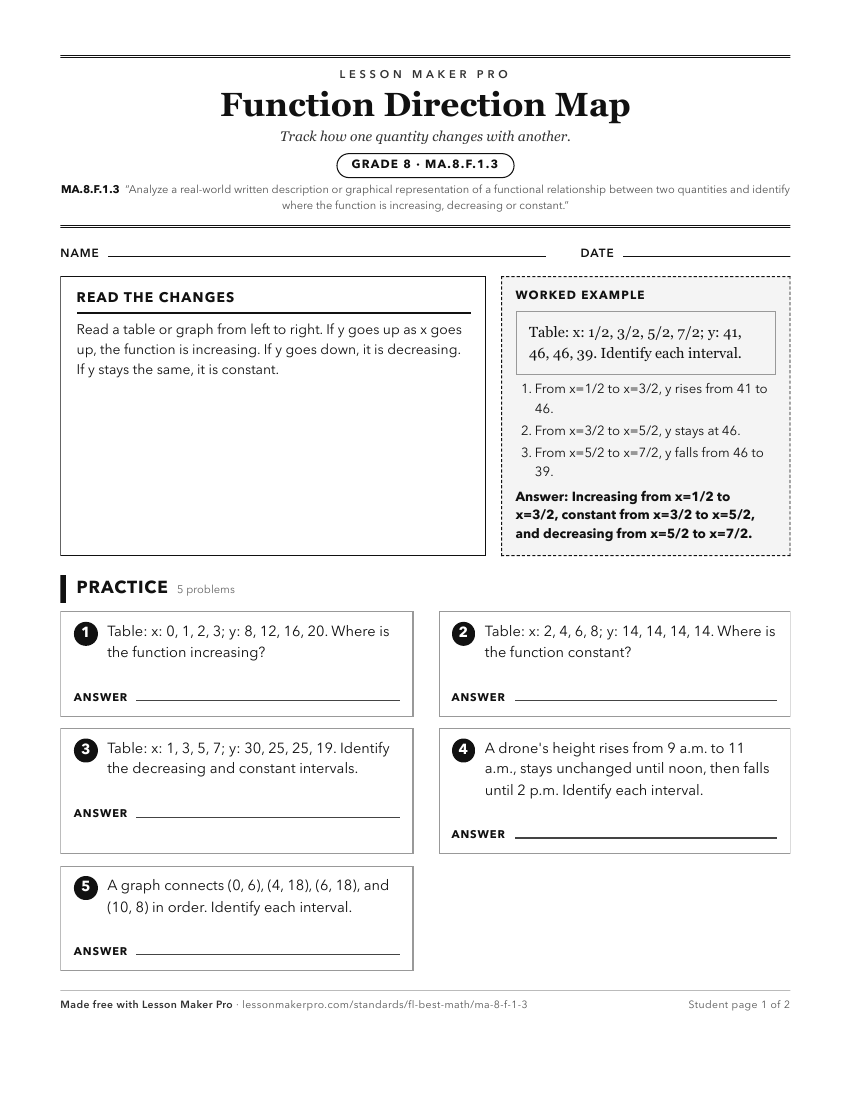
A ready-to-print activity worksheet aligned to MA.8.F.1.3, with an answer key for the teacher on its own page. No account needed.
PDF, US Letter, prints cleanly in black and white.
Download the worksheetKeep exploring
Related Standards
- MA.7.AR.4.1
Determine whether two quantities have a proportional relationship by examining a table, graph or written description.
- MA.912.AR.4.3
Given a table, equation or written description of an absolute value function, graph that function and determine its key features.
- MA.912.AR.2.7
Write two-variable linear inequalities to represent relationships between quantities from a graph or a written description within a mathematical or real-world c...
- MA.912.AR.2.4
Given a table, equation or written description of a linear function, graph that function, and determine and interpret its key features.
Turn this exact standard into a lesson
Grade, subject, topic, and the complete standard are prefilled. Create one free, no account needed.
Also for this standard:Make a WorksheetMake a QuizMake a Sub Lesson