Florida B.E.S.T. MA.8.F.1.2
The Standard
Given a function defined by a graph or an equation, determine whether the function is a linear function. Given an input-output table, determine whether it could represent a linear function.
Florida B.E.S.T. Standards for Mathematics
Teacher's field guide
What This Standard Means
What Students Need to Do
- Students decide whether a graph, equation, or input-output table shows a constant rate of change. They use a straight graph, an equation in y = mx + b form, or equal rates between table points as evidence.
What Mastery Looks Like
- A student correctly classifies linear and nonlinear examples in graphs, equations, and tables. The student calculates rates between table rows, rewrites equations when needed, and explains each decision with specific evidence.
Common Misconceptions
- Students may call any increasing graph linear, even when it curves. They may compare output differences without checking that input differences are equal. They may think a constant function is nonlinear because its graph is horizontal.
How to Assess It
- Exit ticket: show a graph of y = x² and the table (0, 1), (2, 5), (5, 11). Students classify each and cite evidence.
Lesson moves
Ways to Teach It
Have students sort graph, equation, and table cards into linear or nonlinear groups, then label the evidence on each card.
Ask, "Can outputs change by different amounts in a linear table?" Students write a claim using examples with unequal input intervals.
Play Linear Detective: teams inspect projected representations, hold up linear or nonlinear cards, and earn a point only with valid evidence.
Compare a taxi fare with a square garden's area, then identify which relationship has a constant rate of change.
Free download
Printable MA.8.F.1.2 Worksheet
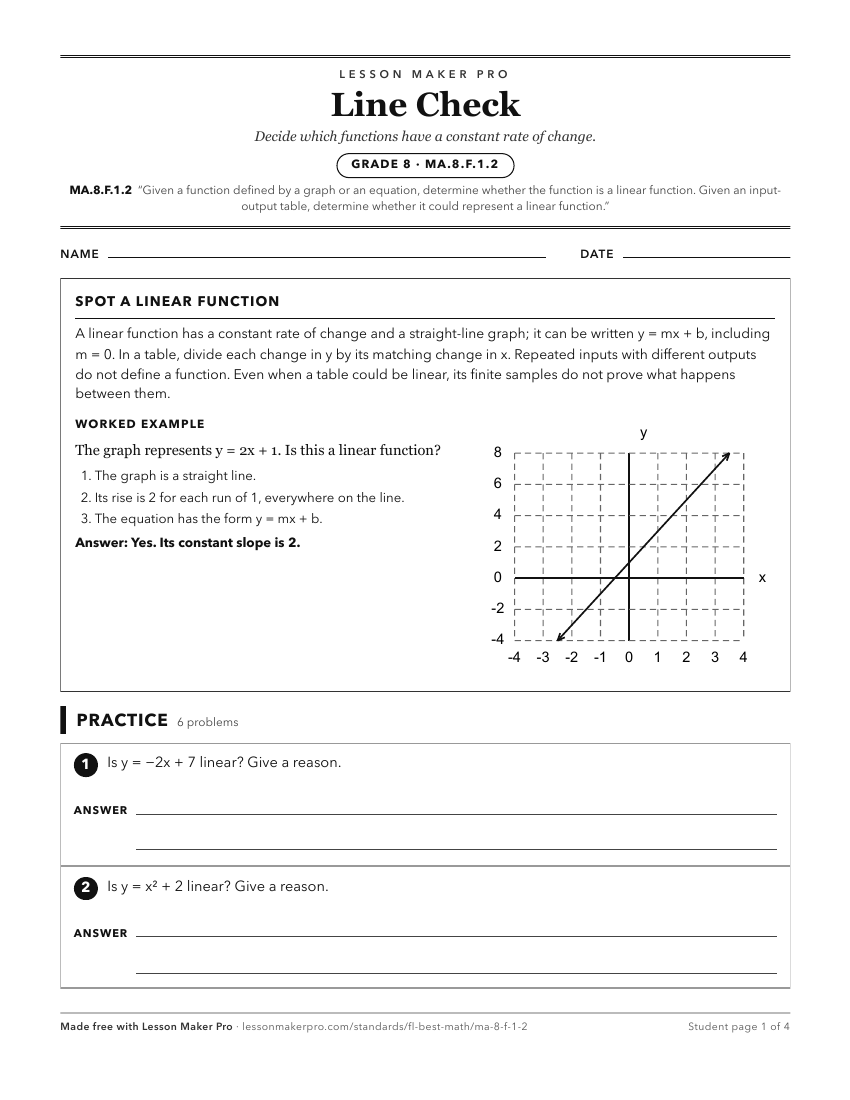
A ready-to-print activity worksheet aligned to MA.8.F.1.2, with an answer key for the teacher on its own page. No account needed.
PDF, US Letter, prints cleanly in black and white.
Download the worksheetKeep exploring
Related Standards
- MA.912.F.1.1
Given an equation or graph that defines a function, determine the function type. Given an input-output table, determine a function type that could represent it.
- MA.8.F.1.1
Given a set of ordered pairs, a table, a graph or mapping diagram, determine whether the relationship is a function. Identify the domain and range of the relati...
- MA.912.AR.2.4
Given a table, equation or written description of a linear function, graph that function, and determine and interpret its key features.
- MA.912.AR.5.8
Given a table, equation or written description of a logarithmic function, graph that function and determine its key features.
Turn this exact standard into a lesson
Grade, subject, topic, and the complete standard are prefilled. Create one free, no account needed.
Also for this standard:Make a WorksheetMake a QuizMake a Sub Lesson