Alabama Social Studies SS24.E.8
Standard Cluster
Explain how economic measurements, including the Consumer Price Index (CPI), the Gross Domestic Product (GDP), inflation rates, labor force participation rate, and unemployment figures, are used to assess the overall economic health of the country. 8a Analyze how spending and production decisions made by households, businesses, and government determine overall levels of income, employment, and prices. 8b Compare and contrast structural, cyclical, and frictional unemployment. 8c Describe the stages of the business cycle and explain how employment and inflation change during those stages. 8d Explain how unemployment and inflation affect individuals and nations, citing specific examples.
2024 Alabama Course of Study: Social Studies
Cluster contents
Standards in This Cluster
SS24.E.8 is a cluster heading. These are the individual standards under it.
- SS24.E.8a
Analyze how spending and production decisions made by households, businesses, and government determine overall levels of income, employment, and prices.
- SS24.E.8b
Compare and contrast structural, cyclical, and frictional unemployment.
- SS24.E.8c
Describe the stages of the business cycle and explain how employment and inflation change during those stages.
- SS24.E.8d
Explain how unemployment and inflation affect individuals and nations, citing specific examples.
Teacher's field guide
What This Cluster Means
What Students Need to Do
- Students use GDP, CPI, inflation, unemployment, and labor force participation figures to judge the economy. They trace how household spending, business production, and government spending affect jobs, income, and prices. They identify business cycle stages and explain how job loss and rising prices affect families and the country.
What Mastery Looks Like
- A student can read economic data, identify a business cycle stage, and describe likely changes in jobs and inflation. They distinguish job changes, skill mismatches, and recession layoffs as frictional, structural, and cyclical unemployment. They connect rising prices to smaller grocery budgets and layoffs to lost income and tax revenue.
Common Misconceptions
- Students may count retirees as unemployed or treat labor force participation as the employment rate. They may call GDP a measure of prices or assume a high CPI means inflation is speeding up. They may label every layoff cyclical or expect prices to fall whenever GDP shrinks.
How to Assess It
- Give students a card showing GDP rising, CPI climbing from 300 to 309 over a year, unemployment falling, and participation staying flat. Ask them to name the likely cycle stage, calculate inflation, and explain one effect on a household.
Lesson moves
Ways to Teach It
Give pairs four dated cards with GDP, CPI, unemployment, and participation; have them plot GDP and label expansion, peak, contraction, and trough.
Ask: If families buy fewer cars, how might automakers change production, hiring, income, and prices, and what could government spending change?
Run a three-bin sort using cards for a new graduate, a cashier replaced by kiosks, and a hotel worker laid off in a recession.
Show recent BLS CPI and unemployment reports; have students link grocery bills and lost paychecks to family budgets and tax revenue.
Free download
Printable SS24.E.8 Worksheet
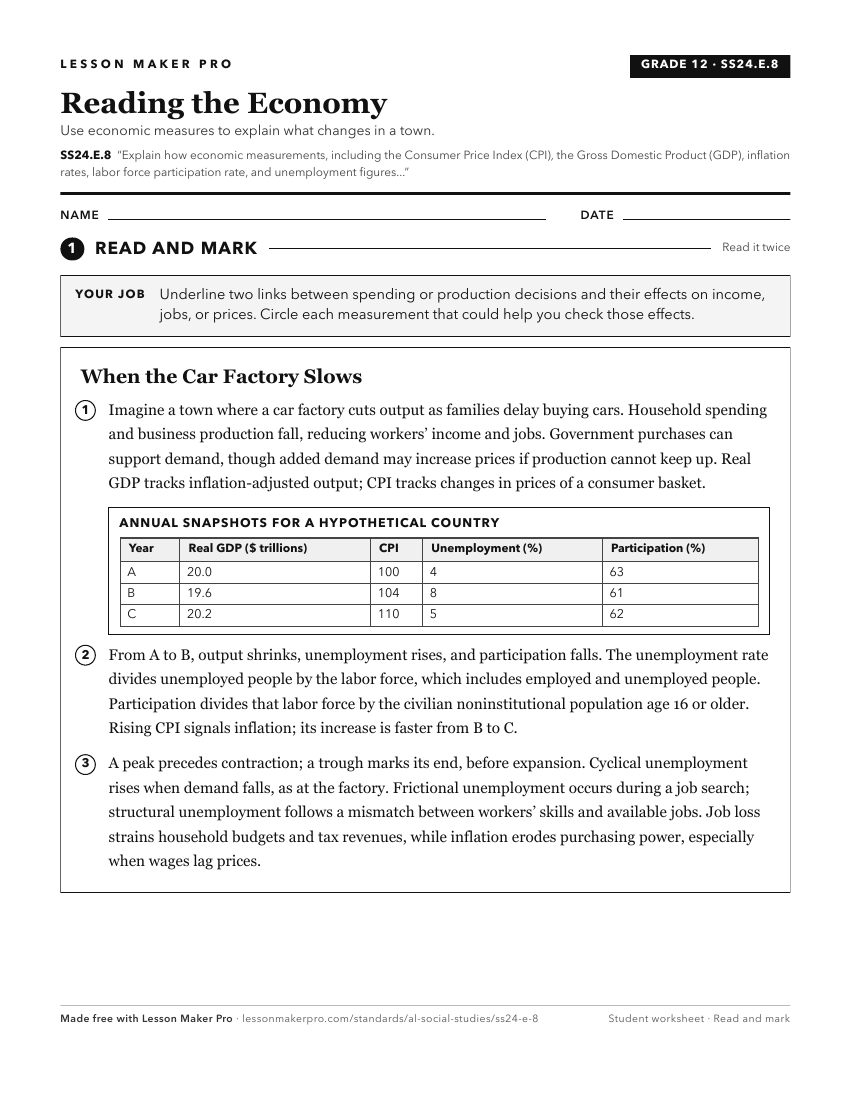
A ready-to-print activity worksheet aligned to SS24.E.8, with an answer key for the teacher on its own page. No account needed.
PDF, US Letter, prints cleanly in black and white.
Download the worksheetKeep exploring
Related Standards
Turn this cluster into a lesson
Grade, subject, topic, and the complete cluster are prefilled. Create one free, no account needed.
Also for this cluster:Make a WorksheetMake a QuizMake a Sub Lesson