Alabama Science 7.6
The Standard
Analyze and interpret data to predict how environmental conditions, genetic factors, and resource availability will impact the growth of individual organisms and populations of organisms in an ecosystem.
2023 Alabama Course of Study: Science · Ecosystems: Interactions, Energy, and Dynamics
Teacher's field guide
What This Standard Means
What Students Need to Do
- Students read tables or graphs showing how organisms grow under different conditions. They compare temperature, available food or water, and inherited traits. They use the data to predict changes in an organism’s size or a population’s numbers.
What Mastery Looks Like
- A student can point to numbers in a table to explain why one group grew more or had more survivors. They can predict what might happen if food becomes scarce or conditions change. They keep an organism’s growth separate from a change in population size.
Common Misconceptions
- Students may think a taller plant means the plant population has grown. They may confuse an inherited drought-tolerance trait with having more water in the soil. They may assume a helpful trait guarantees survival.
How to Assess It
- Exit ticket: In a dry season, 50 drought-tolerant seedlings grew 6 cm on average and 40 survived. Another 50 seedlings grew 2 cm on average and 15 survived. Ask which group is likely to grow taller and have more survivors next dry season, and require two numbers as evidence.
Lesson moves
Ways to Teach It
Set up four cups with two radish varieties and two water levels; label each cup and record starting seed counts.
Show plant-height and survivor-count graphs after a heat wave; ask, “Can taller plants mean fewer plants? Explain with numbers.”
Give pairs rainfall, acorn, and mouse-count cards; have them match conditions to counts and defend one prediction.
Read two seed catalog descriptions, one drought-tolerant and one not; predict which would leave more surviving seedlings in a dry garden.
Free download
Printable 7.6 Worksheet
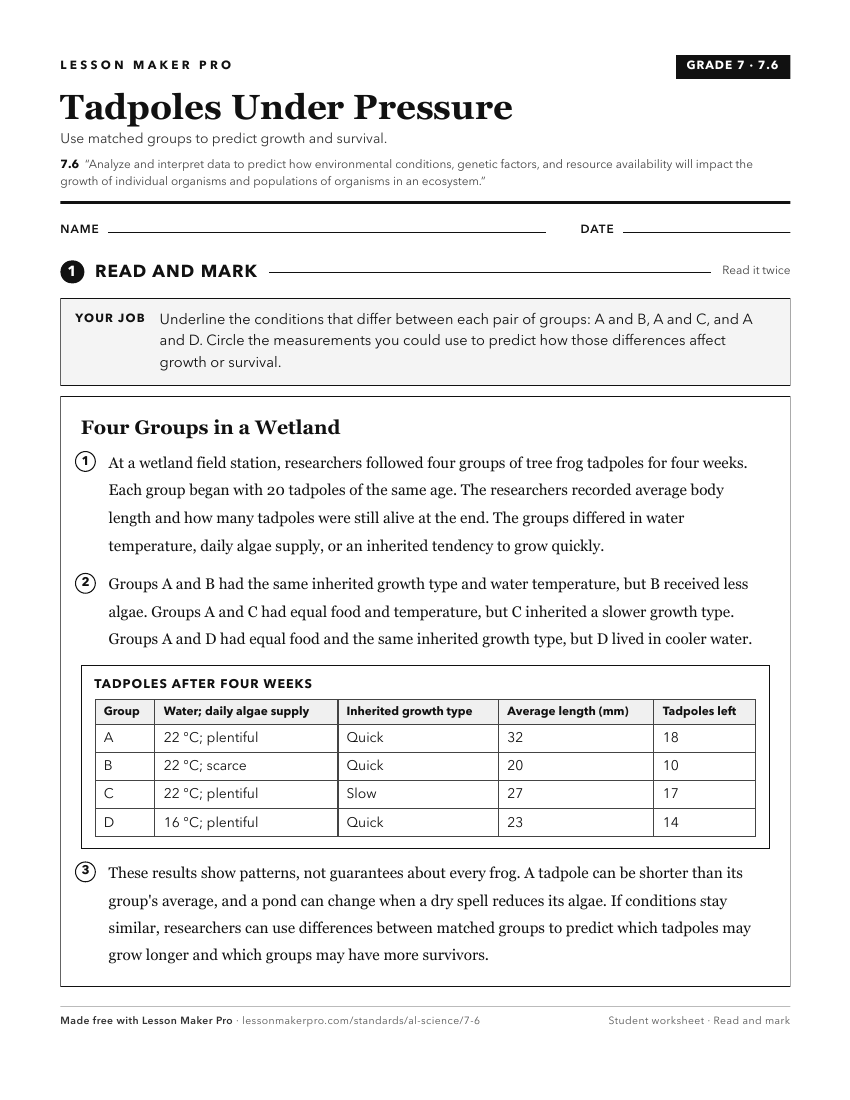
A ready-to-print activity worksheet aligned to 7.6, with an answer key for the teacher on its own page. No account needed.
PDF, US Letter, prints cleanly in black and white.
Download the worksheetKeep exploring
Related Standards
- 7.7
Analyze and interpret data to explain how density-independent and density-dependent limiting factors in an ecosystem can lead to shifts in populations.
- ES.12
Obtain, evaluate, and communicate information to describe the effects of human population growth on global ecosystems.
- BIO.14
Analyze and interpret data pertaining to adaptations resulting from natural and artificial selection to explain the evolution of populations.
Turn this exact standard into a lesson
Grade, subject, topic, and the complete standard are prefilled. Create one free, no account needed.
Also for this standard:Make a WorksheetMake a QuizMake a Sub Lesson