Alabama Math A1P.AF.E
Standard Cluster
Functions shift the emphasis from a point-by-point relationship between two variables (input/output) to considering an entire set of ordered pairs (where each first element is paired with exactly one second element) as an entity with its own features and characteristics.
2019 Alabama Course of Study: Mathematics · Algebra I With Probability
Cluster contents
Standards in This Cluster
A1P.AF.E is a cluster heading. These are the individual standards under it.
- A1P.AF.E.14
Given a relation defined by an equation in two variables, identify the graph of the relation as the set of all its solutions plotted in the coordinate plane.
- A1P.AF.E.15
Define a function as a mapping from one set (called the domain) to another set (called the range) that assigns to each element of the domain exactly one element...
- A1P.AF.E.15.b
Relate the domain of a function to its graph and, where applicable, to the quantitative relationship it describes. Limit to linear, quadratic, exponential, and ...
- A1P.AF.E.16
Compare and contrast relations and functions represented by equations, graphs, or tables that show related values; determine whether a relation is a function. E...
- A1P.AF.E.17
Combine different types of standard functions to write, evaluate, and interpret functions in context. Limit to linear, quadratic, exponential, and absolute valu...
- A1P.AF.E.17.a
Use arithmetic operations to combine different types of standard functions to write and evaluate functions.
- A1P.AF.E.17.b
Use function composition to combine different types of standard functions to write and evaluate functions.
Teacher's field guide
What This Cluster Means
What Students Need to Do
- Students look at a function as a whole relationship, not just one calculation. They check that each input has one output. They use graphs, tables, and rules to describe possible inputs and outputs and how the function changes.
What Mastery Looks Like
- Given a graph, a student can state its domain and range, find its lowest point, and tell where it rises or falls. They can explain why two different outputs for the same input would break the function rule.
Common Misconceptions
- Students may think repeated outputs mean a relationship is not a function. They may list only the marked points as the domain of a continuous graph, or assume every function makes a straight line.
How to Assess It
- Draw y = (x - 1)² from x = -2 to x = 4, with filled endpoints. Ask students for its domain, range, lowest point, and why it is a function.
Lesson moves
Ways to Teach It
Hand out graph paper and integer input cards from -3 to 3; students graph y = x² and mark its lowest point.
Display graphs of y = x² and y = x² + 3, then ask students to explain what changed and what stayed the same.
Match graph, table, and rule cards for y = x², y = x² + 3, and y = 2x + 1; explain each match.
Compare two taxi fares, $4 plus $2 per mile and $7 plus $1 per mile, by graphing both and finding where they cost the same.
Free download
Printable A1P.AF.E Worksheet
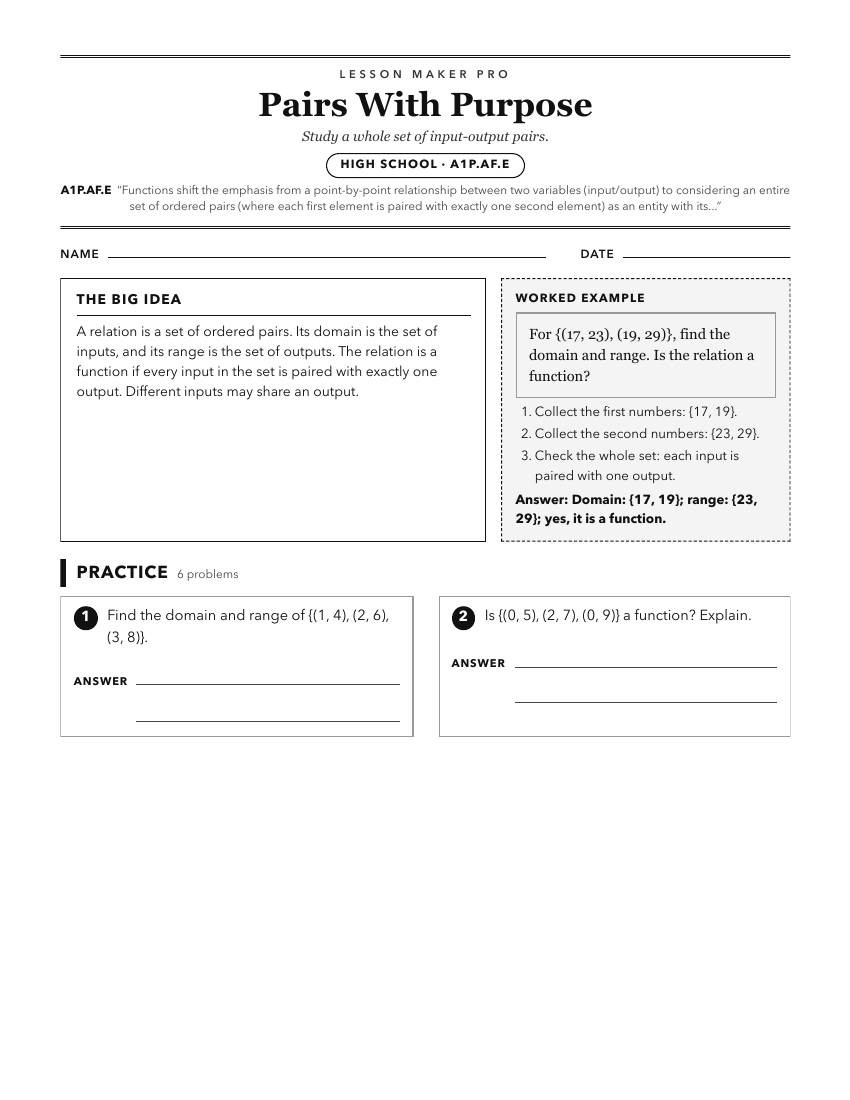
A ready-to-print activity worksheet aligned to A1P.AF.E, with an answer key for the teacher on its own page. No account needed.
PDF, US Letter, prints cleanly in black and white.
Download the worksheetKeep exploring
Related Standards
- 8A.AF.F
Functions shift the emphasis from a point-by-point relationship between two variables (input/output) to considering an entire set of ordered pairs (where each f...
- 5.OA.B.2.b
Form ordered pairs from values in an input/output table.
- A1P.AF.H.28
For a function that models a relationship between two quantities, interpret key features of graphs and tables in terms of the quantities, and sketch graphs show...
- MM.D3D.B.15.b
Describe the overall relationship between two quantitative variables (increase, decrease, linearity, concavity, extrema, inflection) or pattern of change.
Turn this cluster into a lesson
Grade, subject, topic, and the complete cluster are prefilled. Create one free, no account needed.
Also for this cluster:Make a WorksheetMake a QuizMake a Sub Lesson