Alabama Math 7A.DSP.C.30
Standard Cluster
- 7A.DSP.C
- Investigate probability models.
Define and develop a probability model, including models that may or may not be uniform, where uniform models assign equal probability to all outcomes and non-uniform models involve events that are not equally likely. a. Collect and use data to predict probabilities of events. b. Compare probabilities from a model to observe frequencies, explaining possible sources of discrepancy.
2019 Alabama Course of Study: Mathematics
Cluster contents
Standards in This Cluster
7A.DSP.C.30 is a cluster heading. These are the individual standards under it.
Teacher's field guide
What This Cluster Means
What Students Need to Do
- Students list outcomes and decide whether they are equally likely. They assign probabilities that total 1, using trial data when needed. They compare predicted probabilities with observed results and explain differences.
What Mastery Looks Like
- For a fair die, students give each face a 1 in 6 chance. For a bag with three red tiles and one blue tile, they predict red 3 in 4 times. After 40 draws with replacement, they compare the red count with 30 and explain why it may differ.
Common Misconceptions
- Students may give red and blue equal chances because there are two colors, even when there are more red tiles. They may treat 3 in 4 as a promise of exactly 30 reds in 40 draws. They may compare raw counts from different sample sizes instead of proportions.
How to Assess It
- Exit ticket: A bag has three red tiles and one blue tile. In 20 draws with replacement, 12 are red. Is the color model uniform? Give the predicted and observed red fractions, and explain the difference.
Lesson moves
Ways to Teach It
Put three red tiles and one blue tile in a cup; pairs draw with replacement 40 times and compare their red fraction with 3/4.
Draw a spinner with two red quarters, one blue, and one green; ask, "Are red and blue equally likely? Why?"
Play sum showdown: list 36 dice pairs, bet on sum 7 or sum 2, then roll 20 times and compare rates.
Post a lunch tally of 12 pizza, 6 salad, and 2 sandwiches; students predict 20 classmates' choices, then survey them.
Free download
Printable 7A.DSP.C.30 Worksheet
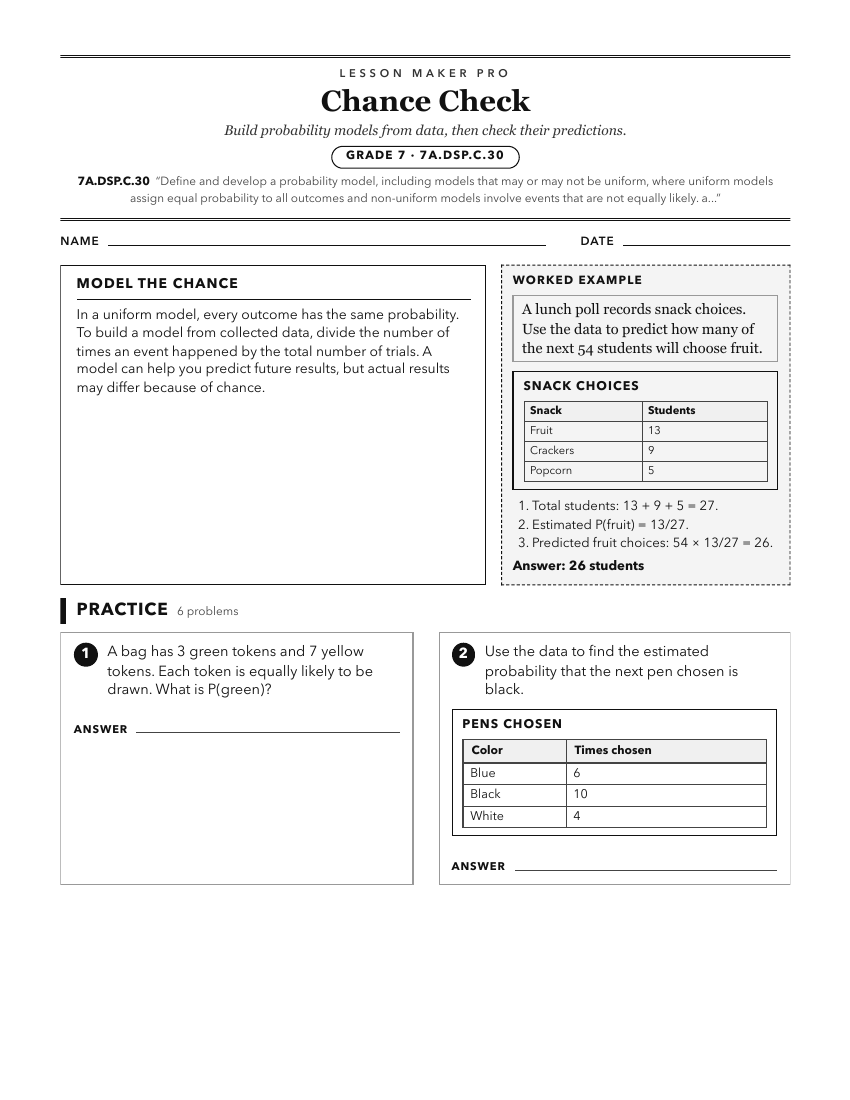
A ready-to-print activity worksheet aligned to 7A.DSP.C.30, with an answer key for the teacher on its own page. No account needed.
PDF, US Letter, prints cleanly in black and white.
Download the worksheetKeep exploring
Related Standards
- 7.DSP.C.14
Define and develop a probability model, including models that may or may not be uniform, where uniform models assign equal probability to all outcomes and non-u...
- 7A.DSP.C
Investigate probability models.
- 7.DSP.C
Investigate probability models.
- 7A.DSP.C.29
Use a number between 0 and 1 to represent the probability of a chance event occurring, explaining that larger numbers indicate greater likelihood of the event o...
Turn this cluster into a lesson
Grade, subject, topic, and the complete cluster are prefilled. Create one free, no account needed.
Also for this cluster:Make a WorksheetMake a QuizMake a Sub Lesson