Alabama Math 7A.DSP.C.30.b
The Standard
- 7A.DSP.C
- Investigate probability models.
- 7A.DSP.C.30
- Define and develop a probability model, including models that may or may not be uniform, where uniform models assign equal probability to all outcomes and non-uniform models involve events that are not equally likely.
Compare probabilities from a model to observe frequencies, explaining possible sources of discrepancy.
2019 Alabama Course of Study: Mathematics · Investigate probability models.
Teacher's field guide
What This Standard Means
What Students Need to Do
- Students predict how often an outcome should happen using a probability model. They compare that prediction with trial results and explain why the numbers might differ.
What Mastery Looks Like
- With a spinner that has one red section out of four equal sections, a student predicts about five reds in 20 spins. If red comes up seven times, they report 35% observed versus 25% predicted and explain that chance could account for the gap.
Common Misconceptions
- Students may think a one-in-four chance guarantees exactly five reds in 20 spins. Some compare an expected count with an observed percentage. Others treat any mismatch as proof that the spinner is unfair.
How to Assess It
- Exit ticket: A spinner has one red section out of four equal sections. It lands on red 8 times in 20 spins. Give the predicted and observed percentages, then name one reason they differ.
Lesson moves
Ways to Teach It
Give pairs a spinner with one red and three blue equal sections; have them spin it 20 times and compare their red count with five expected.
Ask, "Why might two groups get different red counts after 20 spins on the same spinner?"
Hand out cards showing red counts from 20 spins; have pairs rank the cards by distance from the predicted five reds.
Show a player with a 75% free-throw rate who made 17 of 20 shots; ask students to compare 17 makes with 15 expected.
Free download
Printable 7A.DSP.C.30.b Worksheet
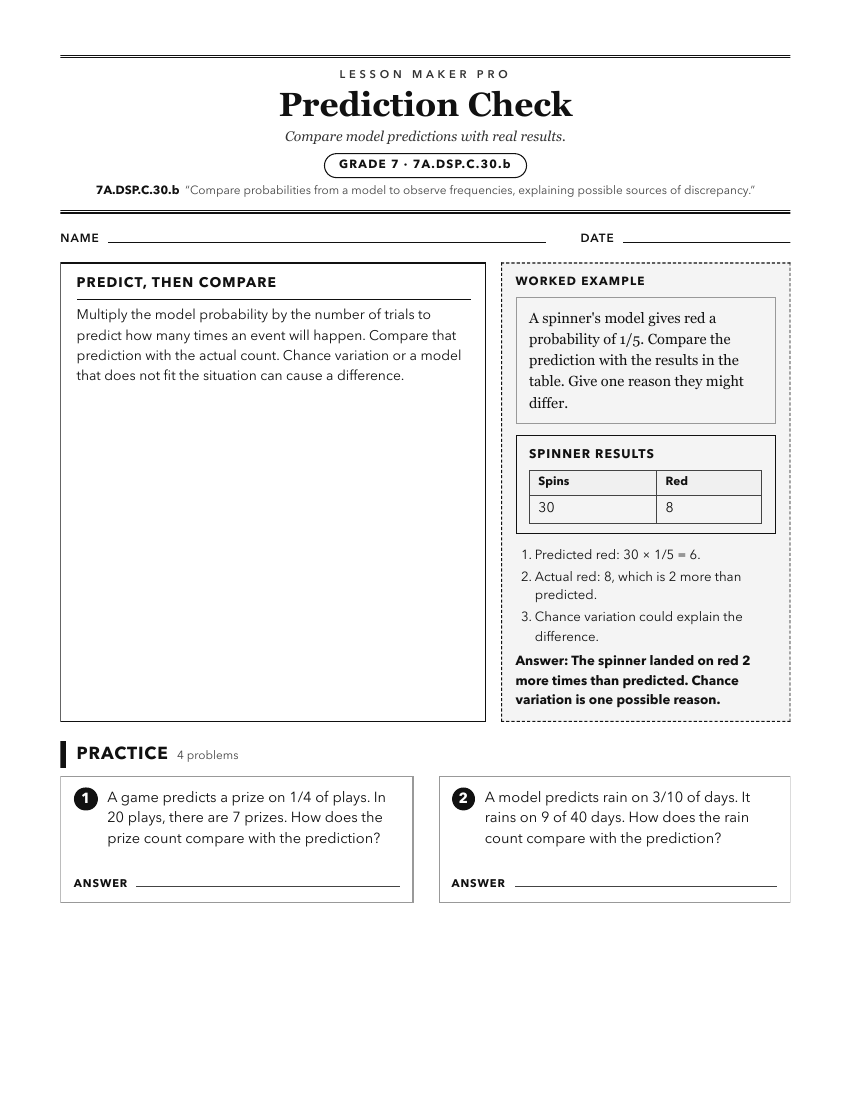
A ready-to-print activity worksheet aligned to 7A.DSP.C.30.b, with an answer key for the teacher on its own page. No account needed.
PDF, US Letter, prints cleanly in black and white.
Download the worksheetKeep exploring
Related Standards
- 7.DSP.C.14.b
Compare probabilities from a model to observed frequencies, explaining possible sources of discrepancy.
- 7A.DSP.C
Investigate probability models.
- 7.DSP.C
Investigate probability models.
- 7A.DSP.C.31.a
Observe the relative frequency of an event over the long run, using simulation or technology, and use those results to predict approximate relative frequency.
Turn this exact standard into a lesson
Grade, subject, topic, and the complete standard are prefilled. Create one free, no account needed.
Also for this standard:Make a WorksheetMake a QuizMake a Sub Lesson