Virginia SOL 5.1.c.iii
The Standard
- 5.1
- The student will demonstrate an understanding of scientific and engineering practices by
interpreting, analyzing, and evaluating data compare and contrast data collected by different groups and discuss similarities and differences in their findings
Virginia Standards of Learning for Science · The student will demonstrate an understanding of scientific and engineering practices by
Teacher's field guide
What This Standard Means
What Students Need to Do
- Students examine results from two groups and identify where the values, patterns, or conclusions agree and differ. They use evidence to suggest reasons for any differences.
What Mastery Looks Like
- A student can compare two tables or graphs and support each observation with specific values. The student can decide whether both groups reached the same conclusion and explain possible reasons for differences.
Common Misconceptions
- Students may assume that different results mean one group is wrong. They may compare graph colors or layouts instead of values and patterns. They may also call close measurements identical without noting the actual difference.
How to Assess It
- Give students two small tables showing plant heights recorded by different teams. Ask them to name one similarity, one difference, and one reasonable cause of the difference.
Lesson moves
Ways to Teach It
Have two teams time the same toy car, then place both result sets side by side and mark matches and gaps.
Ask, "Why might two groups studying the same event report different results, and which explanation best fits the evidence?"
Play Data Match: students pair result cards from two teams, then earn a point for explaining one similarity and one difference.
Give students two local weather reports for the same day and have them explain why temperature or rainfall readings differ.
Free download
Printable 5.1.c.iii Worksheet
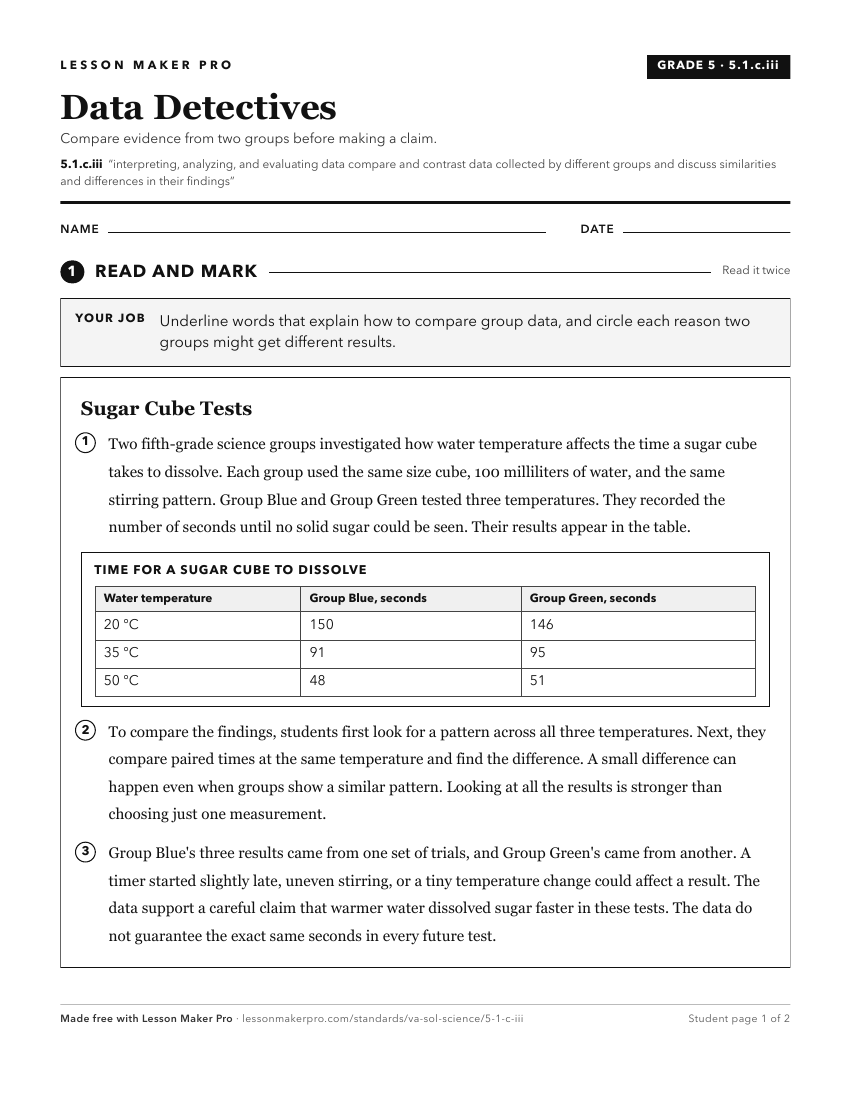
A ready-to-print activity worksheet aligned to 5.1.c.iii, with an answer key for the teacher on its own page. No account needed.
PDF, US Letter, prints cleanly in black and white.
Download the worksheetKeep exploring
Related Standards
- LS.1.c.iii
compare and contrast data collected by different groups and discuss similarities and differences in their findings
- 6.1.c.i
organize data sets to reveal patterns that suggest relationships
- 4.1.c.iii
compare two different representations of the same data (e.g., a set of data displayed on a chart and a graph)
- 6.1.c.iii
compare and contrast data collected by different groups and discuss similarities and differences in findings
Turn this exact standard into a lesson
Grade, subject, topic, and the complete standard are prefilled. Create one free, no account needed.
Also for this standard:Make a WorksheetMake a QuizMake a Sub Lesson