Virginia SOL 5.PS.1.e.ii
The Standard
make inferences about data represented in line plots (dot plots) and stem-and-leaf plots (e.g., based on a line plot (dot plot) of the number of books students in a bus line have in their backpack, every student will have from two to four books in their backpack)
Virginia Standards of Learning for Mathematics · The student will apply the data cycle (formulate questions; collect or acquire data; organize and represent data; and analyze data and communicate results) with a focus on line plots (dot plots) and stem-and-leaf plots.
Teacher's field guide
What This Standard Means
What Students Need to Do
- Students read line plots and stem-and-leaf plots to find patterns such as clusters, gaps, spread, and common values. They use those patterns to make reasonable claims and explain the evidence behind them.
What Mastery Looks Like
- Students accurately identify values, frequencies, clusters, gaps, and the overall spread. They make a reasonable inference and support it with specific evidence from the plot, both orally and in writing.
Common Misconceptions
- Students may read the height of a dot stack as a data value instead of a frequency. They may reverse stem and leaf place values or ignore the key. Some make claims about all students when the plot only supports a claim about the group shown.
How to Assess It
- Give students a stem-and-leaf plot with the key 1|2 = 12 minutes. Ask, “What can you infer about this group’s reading time? Support your answer with two facts from the plot.”
Lesson moves
Ways to Teach It
Have students place sticky-note dots above a number line showing books in their backpacks, then write one supported inference about the class.
Show two stem-and-leaf plots and ask, “How are these groups different?” Require students to cite two values or patterns.
Run a card sort matching line plots and stem-and-leaf plots with valid inferences and supporting evidence statements.
Record lunch-line wait times, make a stem-and-leaf plot, and infer when students should arrive to avoid the longest waits.
Free download
Printable 5.PS.1.e.ii Worksheet
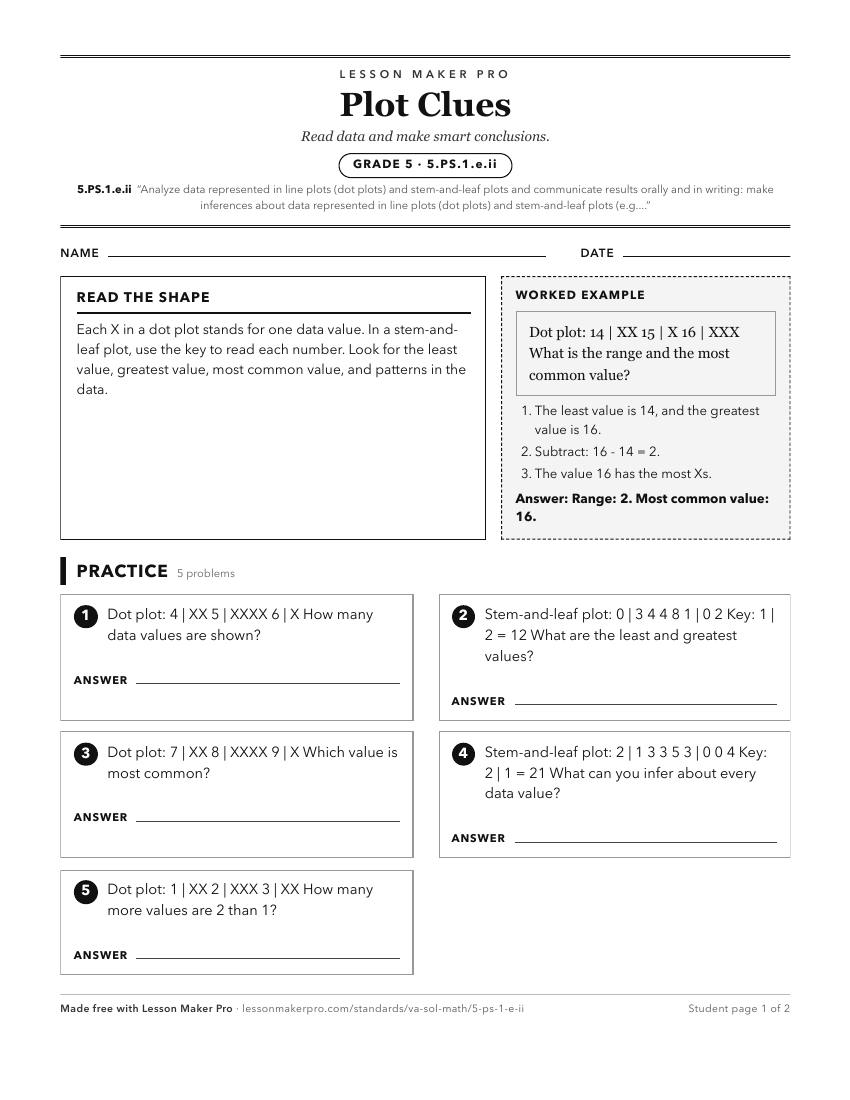
A ready-to-print activity worksheet aligned to 5.PS.1.e.ii, with an answer key for the teacher on its own page. No account needed.
PDF, US Letter, prints cleanly in black and white.
Download the worksheetKeep exploring
Related Standards
- 3.PS.1.e.iii
make inferences about data represented in pictographs and bar graphs
- 4.PS.1.d.iii
make inferences about data represented in line graphs
- 5.PS.1
The student will apply the data cycle (formulate questions; collect or acquire data; organize and represent data; and analyze data and communicate results) with...
- 5.PS.1.e.v
solve single-step and multistep addition and subtraction problems using data from line plots (dot plots) and stem-and-leaf plots.
Turn this exact standard into a lesson
Grade, subject, topic, and the complete standard are prefilled. Create one free, no account needed.
Also for this standard:Make a WorksheetMake a QuizMake a Sub Lesson