TEKS Math 7.1.E
The Standard
create and use representations to organize, record, and communicate mathematical ideas
Texas Essential Knowledge and Skills for Mathematics
Teacher's field guide
What This Standard Means
What Students Need to Do
- Students choose and create tables, graphs, diagrams, equations, or words to show mathematical thinking. They organize and label information, then use the representation to explain a pattern, relationship, or solution.
What Mastery Looks Like
- Students create accurate tables, graphs, diagrams, equations, or written explanations for a mathematical situation. They label each representation clearly and explain how the same values or relationships appear across forms.
Common Misconceptions
- Students may make a graph, table, or equation that does not match the given information. They may omit labels, units, titles, or scales, making the representation hard to interpret.
How to Assess It
- Give this prompt: “A gym charges $12 to join and $5 per visit. Show the cost with a table, graph, and equation, then circle the clearest representation and explain why.”
Lesson moves
Ways to Teach It
Build growing tile figures, record each stage in a table, graph the data, and write a rule that matches the pattern.
Show the same relationship as a table and graph, then ask students which form communicates the pattern better and why.
Play a card match game where students pair situation, table, graph, equation, and verbal description cards that represent the same relationship.
Use a grocery receipt to organize item prices in a table, display spending by category, and explain which representation is clearest.
Free download
Printable 7.1.E Worksheet
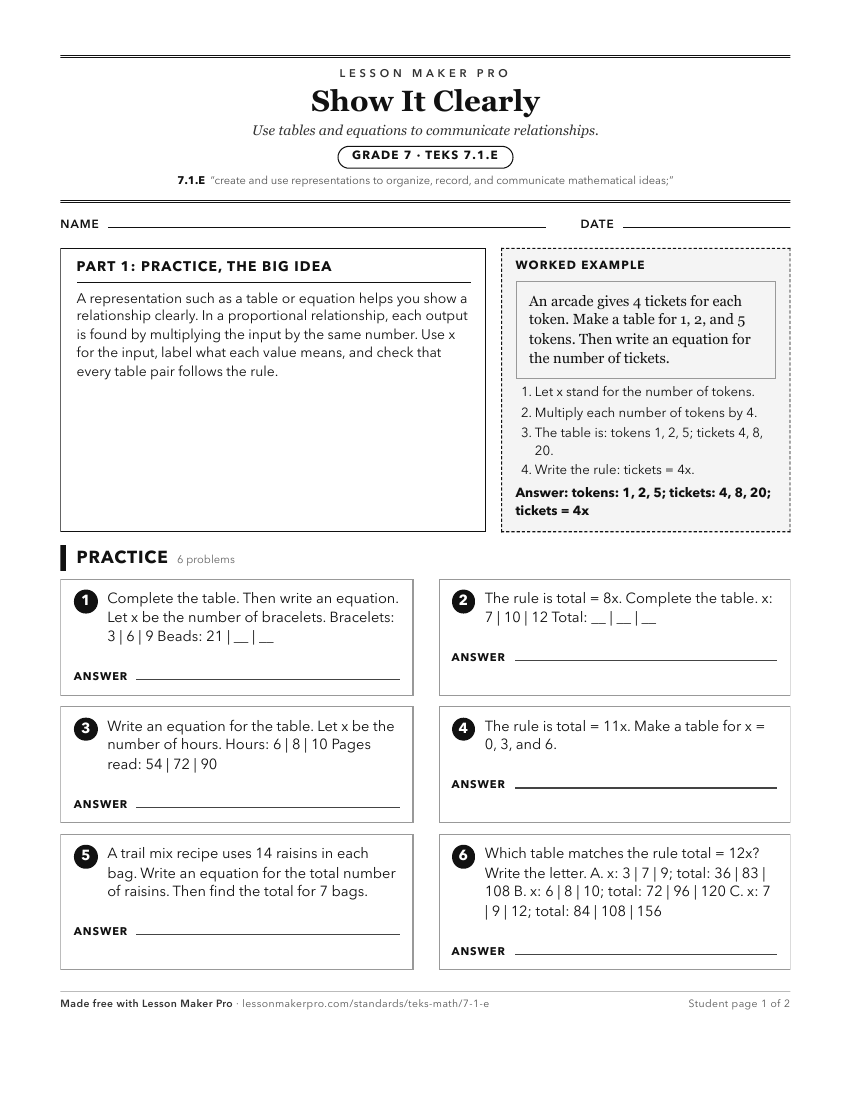
A ready-to-print activity worksheet aligned to 7.1.E, with an answer key for the teacher on its own page. No account needed.
PDF, US Letter, prints cleanly in black and white.
Download the worksheetKeep exploring
Related Standards
Turn this exact standard into a lesson
Grade, subject, topic, and the complete standard are prefilled. Create one free, no account needed.
Also for this standard:Make a WorksheetMake a QuizMake a Sub Lesson