Oklahoma Math S.Q.2.1
The Standard
- S.Q.2
- Distinguish between the distribution of a population, a distribution of sample data, and a sampling distribution.
Distinguish between sample statistics and population parameters.
Oklahoma Academic Standards for Mathematics (2022)
Teacher's field guide
What This Standard Means
What Students Need to Do
- Students tell apart a number calculated from an entire group and one calculated from a sample. They identify which number a survey gives them and which value it aims to estimate. They recognize that results from different samples can change while the population value stays fixed.
What Mastery Looks Like
- Given 18 of 30 surveyed students who prefer pizza, a student calls 18/30 a sample proportion. They can name the proportion among all students as the population parameter, even when its value is unknown.
Common Misconceptions
- Students may treat a sample percentage as the population percentage because the sample is large. They may think the population parameter changes when a new sample is taken. They may call one sample's result a sampling distribution.
How to Assess It
- Exit ticket: A school has 800 students, and 52 of 80 surveyed students own bikes. Label 52/80 and describe the population value it estimates.
Lesson moves
Ways to Teach It
Put 40 red and 60 blue counters in a bag. Groups draw 10, record the red fraction, and compare it with the bag's red fraction.
Write: In a school of 600, 18 of 30 surveyed students favor pizza. Which fraction is known, and what fraction is unknown?
Give pairs cards reading '18 of 30 surveyed' and '360 of 600 students'; have them sort the fractions as statistics or parameters.
Write '54% of 500 voters polled favor a bus route' on the board; students name the measured statistic and unknown citywide parameter.
Free download
Printable S.Q.2.1 Worksheet
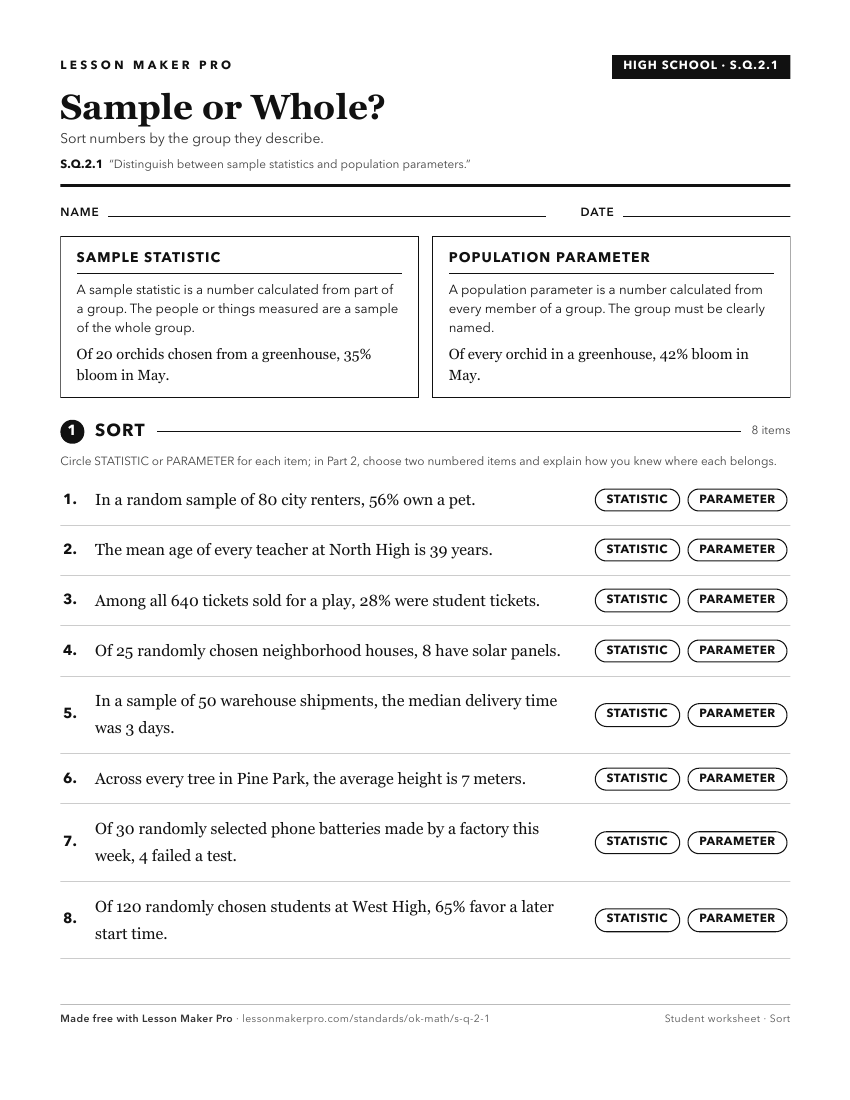
A ready-to-print activity worksheet aligned to S.Q.2.1, with an answer key for the teacher on its own page. No account needed.
PDF, US Letter, prints cleanly in black and white.
Download the worksheetKeep exploring
Related Standards
- S.Q.2
Distinguish between the distribution of a population, a distribution of sample data, and a sampling distribution.
- S.Q.2.2
Recognize a population distribution has fixed values of its parameters and that these parameter values are typically unknown.
- S.Q.2.4
Recognize a sampling distribution is the distribution of a sample statistic (e.g., sample mean, sample proportion) obtained from repeated samples.
- S.Q.2.3
Recognize that a sample data distribution is taken from a population distribution, and the data distribution is what is seen in practice.
Turn this exact standard into a lesson
Grade, subject, topic, and the complete standard are prefilled. Create one free, no account needed.
Also for this standard:Make a WorksheetMake a QuizMake a Sub Lesson