Oklahoma Math S.Q.2.4
The Standard
- S.Q.2
- Distinguish between the distribution of a population, a distribution of sample data, and a sampling distribution.
Recognize a sampling distribution is the distribution of a sample statistic (e.g., sample mean, sample proportion) obtained from repeated samples.
Oklahoma Academic Standards for Mathematics (2022)
Teacher's field guide
What This Standard Means
What Students Need to Do
- Students tell apart the values for a whole group, the values in one sample, and statistics from many samples. They make a dotplot of means or proportions from repeated samples.
What Mastery Looks Like
- Given three dotplots, students can identify the whole group's values, one sample's values, and the means from many samples. They can explain why each dot on the last plot represents a whole sample, not one person.
Common Misconceptions
- Students often call the values in one sample a sampling distribution. They may think each dot in a plot of sample means represents one person's value, or that every sample has the same mean.
How to Assess It
- Exit ticket: A class has 30 quiz scores; you record five scores, then repeat the draw 20 times and record each mean. Label the population values, one sample, and the sampling distribution, and say what one mean represents.
Lesson moves
Ways to Teach It
Give groups identical bags of 20 numbered slips; each draws five with replacement, graphs its sample, and adds its mean to a class dotplot.
Show plots of all 20 slip values, one group's five values, and the class means; ask which plot uses repeated samples and why.
Give pairs three dotplots: 30 class heights, five sampled heights, and 20 means from repeated samples of five; have them label each plot.
Using a sheet of 30 lunch votes, have groups take repeated polls of five and plot each poll's percentage choosing pizza.
Free download
Printable S.Q.2.4 Worksheet
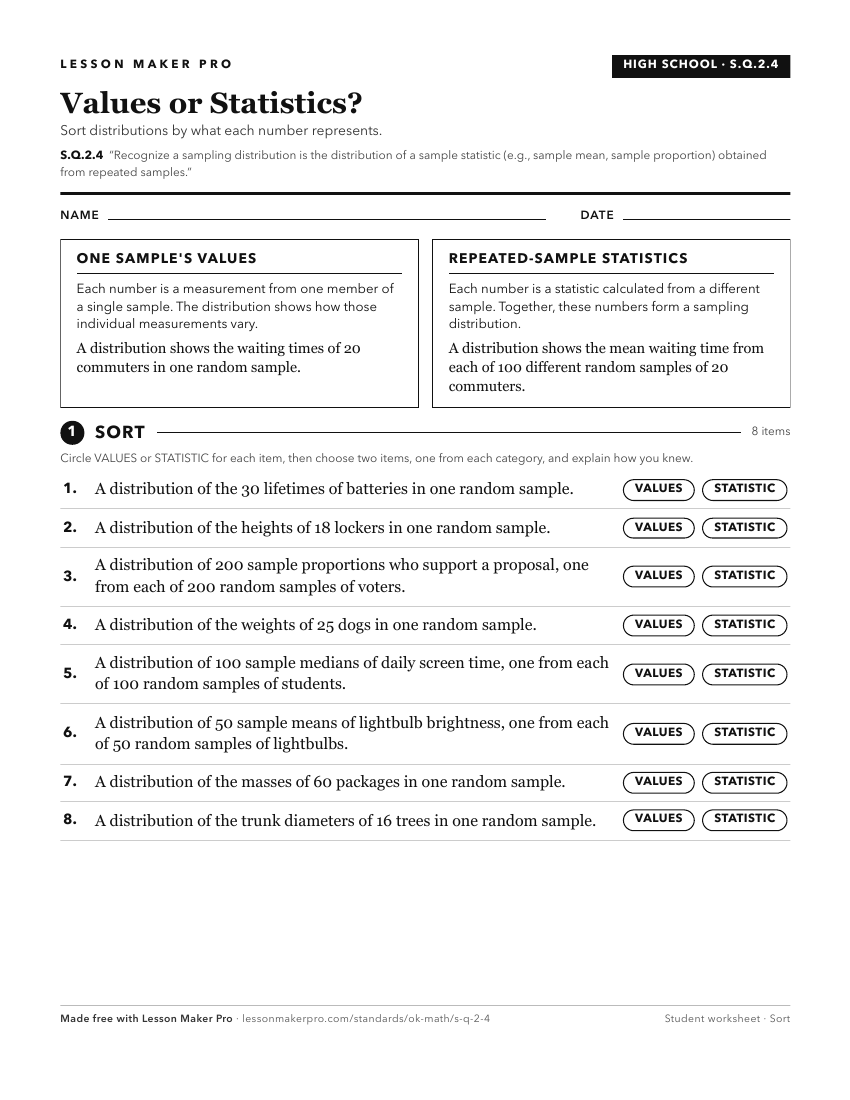
A ready-to-print activity worksheet aligned to S.Q.2.4, with an answer key for the teacher on its own page. No account needed.
PDF, US Letter, prints cleanly in black and white.
Download the worksheetKeep exploring
Related Standards
- S.Q.2
Distinguish between the distribution of a population, a distribution of sample data, and a sampling distribution.
- S.Q.2.3
Recognize that a sample data distribution is taken from a population distribution, and the data distribution is what is seen in practice.
- S.IR.1.1
Recognize when the difference between two sample proportions or two sample means is due to random variation or if the difference is statistically significant.
- S.Q.2.2
Recognize a population distribution has fixed values of its parameters and that these parameter values are typically unknown.
Turn this exact standard into a lesson
Grade, subject, topic, and the complete standard are prefilled. Create one free, no account needed.
Also for this standard:Make a WorksheetMake a QuizMake a Sub Lesson