Oklahoma Math S.Q.1
Standard Cluster
Understand the distinction between mathematical models and statistical models. Distinguish among different sources of variability, including measurement, natural, induced, and sampling variability. Formulate meaningful statistical questions to clarify the problem at hand.
Oklahoma Academic Standards for Mathematics (2022)
Cluster contents
Standards in This Cluster
S.Q.1 is a cluster heading. These are the individual standards under it.
Teacher's field guide
What This Cluster Means
What Students Need to Do
- Students decide whether a fixed rule or a model that allows variation fits a situation. They identify differences caused by measuring, natural variation, planned changes, or sample choice. They write questions that need data from several cases.
What Mastery Looks Like
- A student can explain why repeated measurements of one desk vary for a different reason than heights across a class. They use one time for a scheduled bus arrival but a range for actual arrivals. They can ask how late the bus runs and name the data needed to answer.
Common Misconceptions
- Students may call every difference a measuring mistake, even when people naturally differ. They may overlook the effect of a planned change, such as jogging before a pulse check. They may assume one sample gives the exact result for the whole class.
How to Assess It
- Exit ticket: A desk gives different ruler readings, classmates have different heights, pulses change after jogging, and two random groups have different mean heights. Label each source of variation, then write a question about the class that needs data rather than a fixed formula.
Lesson moves
Ways to Teach It
Measure the same desk five times with two rulers, then mark which differences come from measuring rather than changes to the desk.
Ask, 'Will students with the same shoe size have the same height?' Have students write a question that would need data to answer.
Sort cards showing repeated ruler readings, classmates' heights, pulses before and after jogging, and two random class samples by source of variation.
Compare a fixed bus schedule with recorded arrival times, then ask, 'How many minutes late does the bus usually arrive?'
Free download
Printable S.Q.1 Worksheet
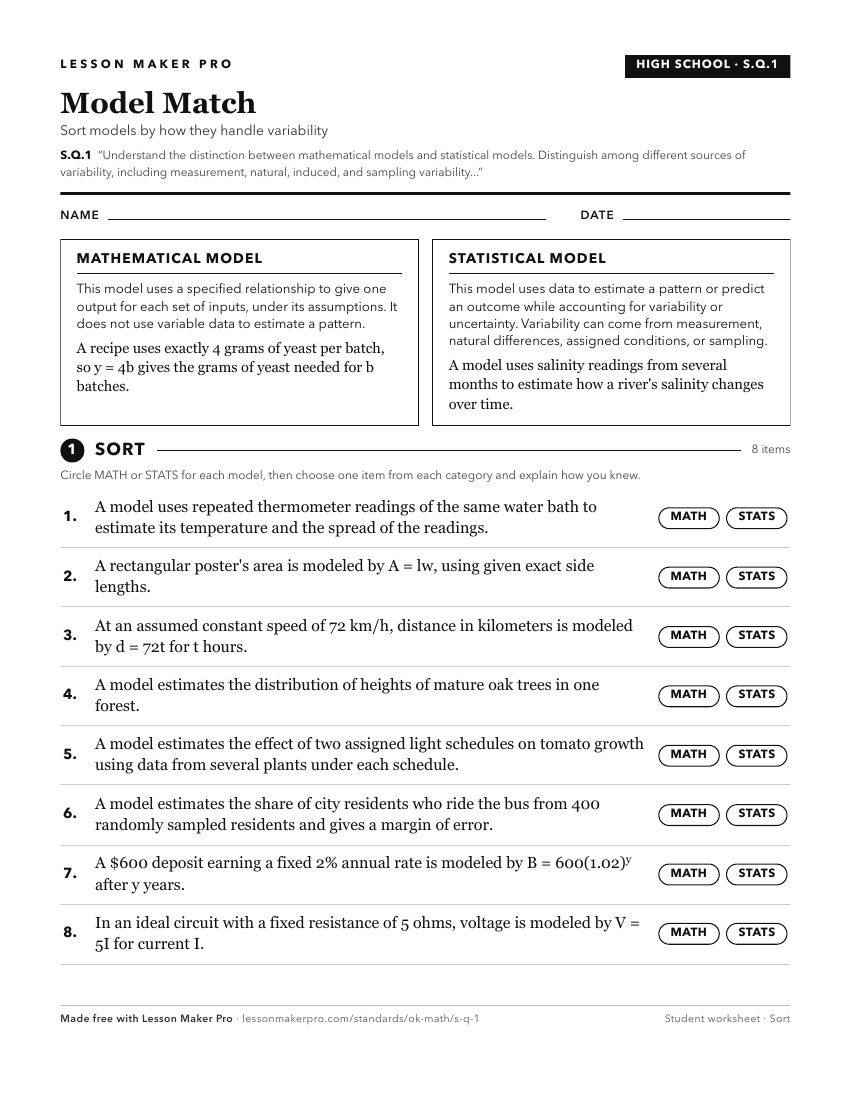
A ready-to-print activity worksheet aligned to S.Q.1, with an answer key for the teacher on its own page. No account needed.
PDF, US Letter, prints cleanly in black and white.
Download the worksheetKeep exploring
Related Standards
- A2.F.1.9
Recognize whether a discrete or continuous graphical representation is appropriate to create a graph based upon a mathematical model.
- 7.A.1
Explain the concept of proportionality in mathematical models and situations and distinguish between proportional and non-proportional relationships.
- PA.A.1.2
Use linear functions to represent and model mathematical situations.
Turn this cluster into a lesson
Grade, subject, topic, and the complete cluster are prefilled. Create one free, no account needed.
Also for this cluster:Make a WorksheetMake a QuizMake a Sub Lesson