Oklahoma Math S.DA.3.1
The Standard
- S.DA.3
- Compare two or more groups by analyzing distributions.
Construct appropriate parallel graphical displays of distributions.
Oklahoma Academic Standards for Mathematics (2022)
Teacher's field guide
What This Standard Means
What Students Need to Do
- Students turn two or more sets of numbers into graphs they can compare side by side. They choose a suitable display, such as aligned dot plots, histograms, or box plots, and use matching scales.
What Mastery Looks Like
- A student can graph each group accurately and label it clearly. The axes or intervals match, so a reader can compare the groups without guessing.
Common Misconceptions
- Students may use different scales for each group, making the graphs look more alike or more different than they are. They may change histogram bin boundaries between groups or plot a repeated value only once.
How to Assess It
- Exit ticket: Draw aligned dot plots for Group A (2, 3, 3, 5) and Group B (1, 3, 4, 6) on the same scale. Label both groups.
Lesson moves
Ways to Teach It
Give pairs two sets of commute times on sticky notes and have them build aligned dot plots on a shared number line.
Show two histograms of quiz scores with different bin boundaries and ask, “What must change before we can compare them?”
Give teams four small data sets and graph cards; have them match each set to a side-by-side box plot and explain one match.
Use daily high temperatures for two cities over one week; have students draw aligned dot plots to compare the cities.
Free download
Printable S.DA.3.1 Worksheet
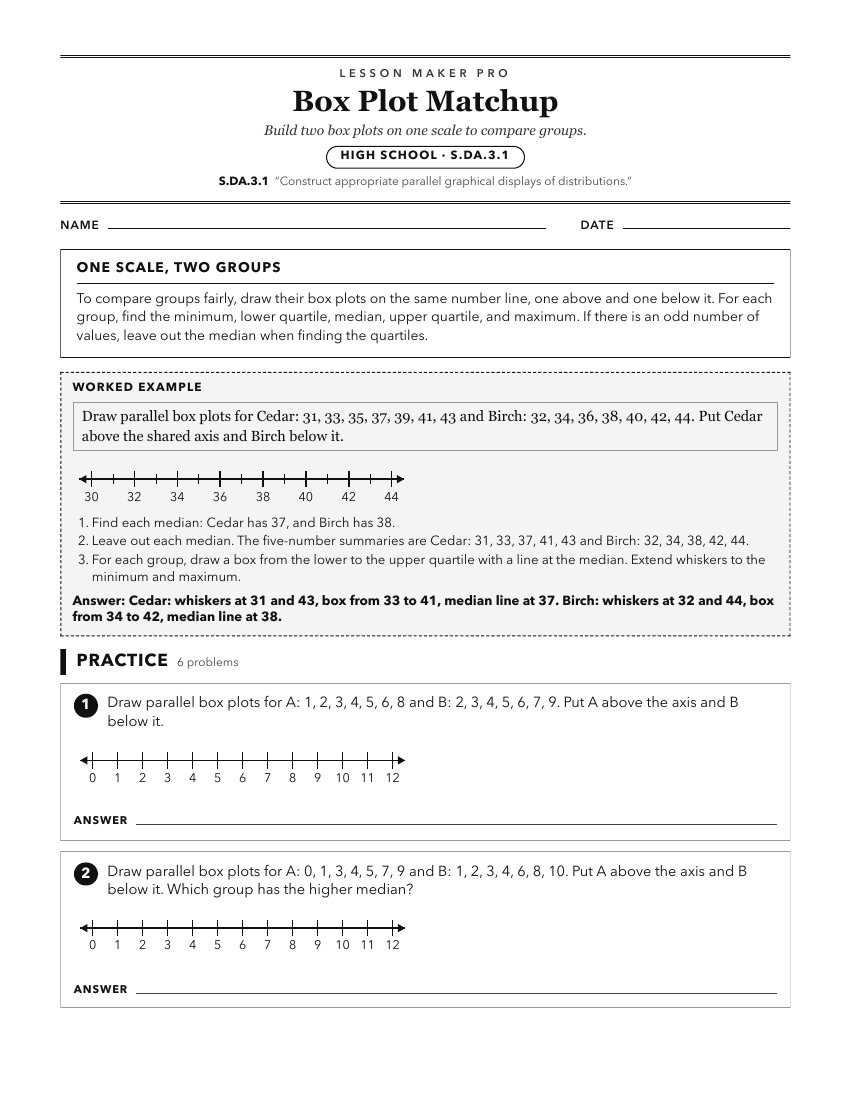
A ready-to-print activity worksheet aligned to S.DA.3.1, with an answer key for the teacher on its own page. No account needed.
PDF, US Letter, prints cleanly in black and white.
Download the worksheetKeep exploring
Related Standards
- S.Q.3.2
Compare and contrast different potential graphical or visual representations given the same data set.
- S.DA.3.2
Use numerical attributes of distributions to make comparisons between distributions.
- S.DA.1.2
Select and create an appropriate display (e.g., dot plots, histograms, box plots) for univariate data.
- S.DA.3
Compare two or more groups by analyzing distributions.
Turn this exact standard into a lesson
Grade, subject, topic, and the complete standard are prefilled. Create one free, no account needed.
Also for this standard:Make a WorksheetMake a QuizMake a Sub Lesson