Oklahoma Math A2.A.1.2
The Standard
- A2.A.1
- Represent and solve mathematical and real-world problems using nonlinear equations, systems of linear equations, and systems of linear inequalities; interpret the solutions in the original context.
Use mathematical models to represent exponential relationships, such as compound interest, depreciation, and population growth. Solve these equations algebraically or graphically (including graphing calculator or other appropriate technology).
Oklahoma Academic Standards for Mathematics (2022)
Teacher's field guide
What This Standard Means
What Students Need to Do
- Students write exponential equations from a starting value and a percent change per time period. They use algebra or a graph to find when a quantity reaches a target, then explain what the answer means.
What Mastery Looks Like
- Given a $20,000 car losing 15% of its value each year, a student writes V = 20000(0.85)^t. They find that it reaches $10,000 after about 4.3 years and label the answer in years.
Common Misconceptions
- Students may subtract the same dollar amount each year instead of taking a percent of the new value. For a 15% loss, they may use 0.15 instead of 0.85 as the multiplier. Some read the graph's dollar value as the number of years.
How to Assess It
- A $12,000 car loses 20% of its value each year. Write a model and find the first whole year its value is below $6,000, using a graph or an equation.
Lesson moves
Ways to Teach It
Start with 64 counters, remove half each round, and record the counts before writing C = 64(0.5)^t.
Write two sentences explaining why a $500 account earning 4% yearly follows 500(1.04)^t rather than 500 + 20t.
Match cards showing a car's starting price, yearly loss rate, equation, and graph; then use the graph to find its half-value time.
Compare two printed savings offers, 3% and 4% annual interest, by graphing $1,000 balances and finding when each reaches $1,500.
Free download
Printable A2.A.1.2 Worksheet
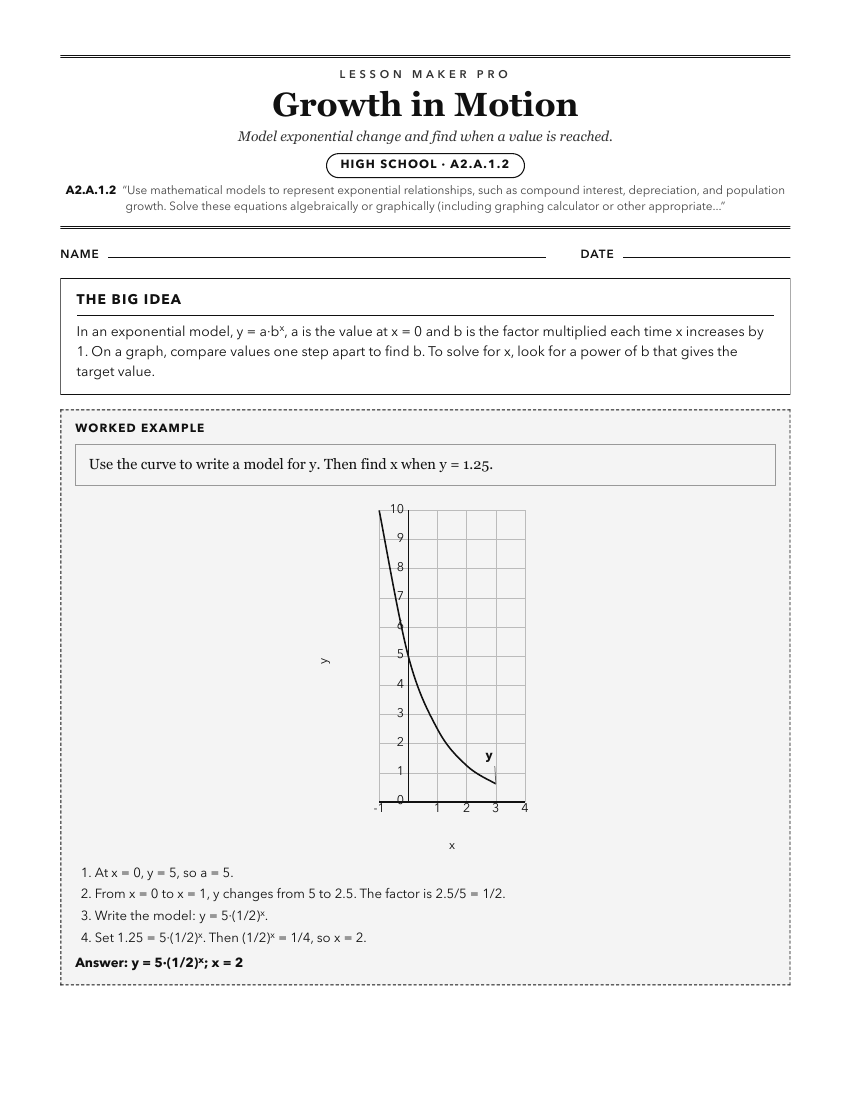
A ready-to-print activity worksheet aligned to A2.A.1.2, with an answer key for the teacher on its own page. No account needed.
PDF, US Letter, prints cleanly in black and white.
Download the worksheetKeep exploring
Related Standards
- A2.A.1.1
Use mathematical models to represent quadratic relationships and solve using factoring, completing the square, the quadratic formula, and various methods (inclu...
- A2.A.3.3
Solve problems that can be modeled using arithmetic sequences or series given the n^th terms and sum formulas. Graphing calculators or other appropriate technol...
- A2.A.1.7
Represent and evaluate mathematical models using systems of linear equations with a maximum of three variables. Graphing calculators or other appropriate techno...
- 6.N.4.4
Use mathematical modeling to solve and interpret problems including money, measurement, geometry, and data requiring arithmetic with decimals, fractions and mix...
Turn this exact standard into a lesson
Grade, subject, topic, and the complete standard are prefilled. Create one free, no account needed.
Also for this standard:Make a WorksheetMake a QuizMake a Sub Lesson