Oklahoma Math A1.F.3
Standard Cluster
Represent functions in multiple ways and use the representation to interpret real-world and mathematical problems. Identify and generate equivalent representations of linear functions, graphs, tables, and real-world situations. Use function notation; evaluate a function, including nonlinear, at a given point in its domain algebraically and graphically. Interpret the results in terms of the original context. Add, subtract, and multiply functions using function notation.
Oklahoma Academic Standards for Mathematics (2022)
Cluster contents
Standards in This Cluster
A1.F.3 is a cluster heading. These are the individual standards under it.
- A1.F.3.1
Identify and generate equivalent representations of linear functions, graphs, tables, and real-world situations.
- A1.F.3.2
Use function notation; evaluate a function, including nonlinear, at a given point in its domain algebraically and graphically. Interpret the results in terms of...
- A1.F.3.3
Add, subtract, and multiply functions using function notation.
Teacher's field guide
What This Cluster Means
What Students Need to Do
- Students connect a linear situation to a table, graph, and equation. They find outputs from rules and graphs, including curved graphs, and explain what those outputs mean. They add, subtract, and multiply function outputs at the same input.
What Mastery Looks Like
- A student matches a linear rule to its table, graph, and story using the starting value and rate. They evaluate a function at an input in its domain and give the output with the right units. They can calculate (f+g)(2), (f−g)(2), and (fg)(2) from given rules.
Common Misconceptions
- Students may read f(3) as f times 3 rather than the output when the input is 3. They may confuse a graph's x-intercept with its starting value or assume a curved graph has a constant rate. When combining functions, they may add the inputs instead of the outputs.
How to Assess It
- Exit ticket: A parking lot charges f(h)=4+2h dollars, plus a weekend fee of g(h)=h² dollars. Make a table for f at 0, 1, and 2 hours, find (f+g)(2), and explain the total cost.
Lesson moves
Ways to Teach It
Give pairs graph paper and $1 counters to model a $4 entry fee plus $2 per hour, then make a table and plot points.
Show a graph of g(x)=x² and ask, “Why do g(−2) and g(2) have the same value?”
Make card sets with linear equations, tables, graphs, and fare descriptions; have teams match four cards and explain their matches.
Compare phone plans A(m)=10+0.05m and B(m)=16+0.02m; ask what A(100)−B(100) says about their costs.
Free download
Printable A1.F.3 Worksheet
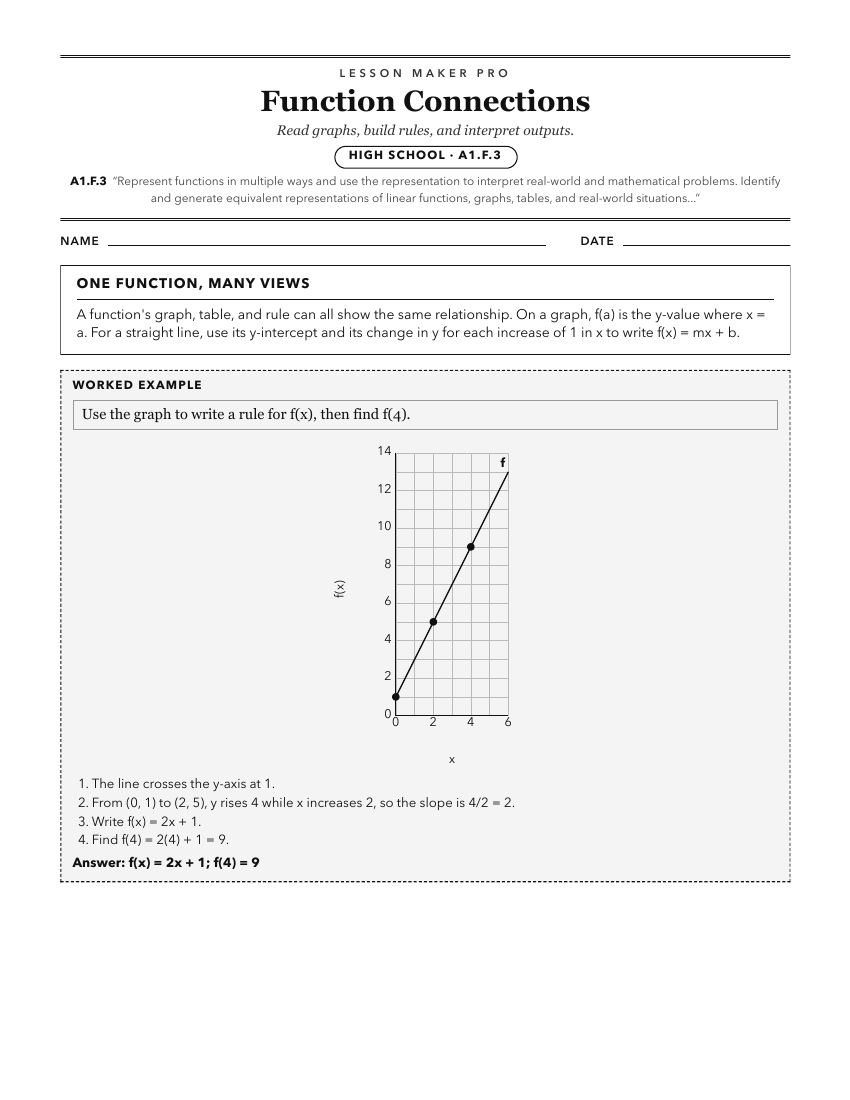
A ready-to-print activity worksheet aligned to A1.F.3, with an answer key for the teacher on its own page. No account needed.
PDF, US Letter, prints cleanly in black and white.
Download the worksheetKeep exploring
Related Standards
- 4.A.1
Describe, create, and analyze multiple representations of patterns to solve real-world and mathematical problems.
- 6.A.1
Recognize and represent relationships between varying quantities; translate from one representation to another; use patterns, tables, graphs, and rules to model...
- PA.A.1.2
Use linear functions to represent and model mathematical situations.
Turn this cluster into a lesson
Grade, subject, topic, and the complete cluster are prefilled. Create one free, no account needed.
Also for this cluster:Make a WorksheetMake a QuizMake a Sub Lesson