Oklahoma Math 7.A.1.1
The Standard
- 7.A.1
- Explain the concept of proportionality in mathematical models and situations and distinguish between proportional and non-proportional relationships.
Identify a relationship between two varying quantities, x and y, as proportional if it can be expressed in the form y/x = k or y = kx; distinguish proportional relationships from non-proportional relationships.
Oklahoma Academic Standards for Mathematics (2022)
Teacher's field guide
What This Standard Means
What Students Need to Do
- Students compare two changing quantities in tables, graphs, and equations. They check whether y divided by x stays the same for every nonzero x. They decide whether the relationship can be written as y = kx.
What Mastery Looks Like
- A student calculates y/x for each pair in a table and identifies the constant ratio. They write an equation such as y = 3x when the ratios match. They explain why a starting fee or changing ratio makes a relationship nonproportional.
Common Misconceptions
- Students may call any straight line proportional, even when it starts above zero. They may mistake a steady increase in y for a steady y/x ratio. Some divide x by y and report the wrong constant.
How to Assess It
- Exit ticket: For x = 1, 2, 3, compare y = 4, 8, 12 with y = 4, 8, 13. Label each relationship, show the ratios, and write an equation for the proportional one.
Lesson moves
Ways to Teach It
Build groups of 1, 2, and 3 cups with 2 counters per cup, then add 3 counters to each group and compare totals per cup.
Ask students to explain in writing why y = 4x + 3 is not proportional, even though y rises by 4 each time x rises by 1.
Give pairs table cards to sort into proportional and nonproportional piles, with students writing y/x beside each row.
Compare a taxi charging $3 per mile with one charging a $5 pickup fee plus $3 per mile for trips of 1, 2, and 3 miles.
Free download
Printable 7.A.1.1 Worksheet
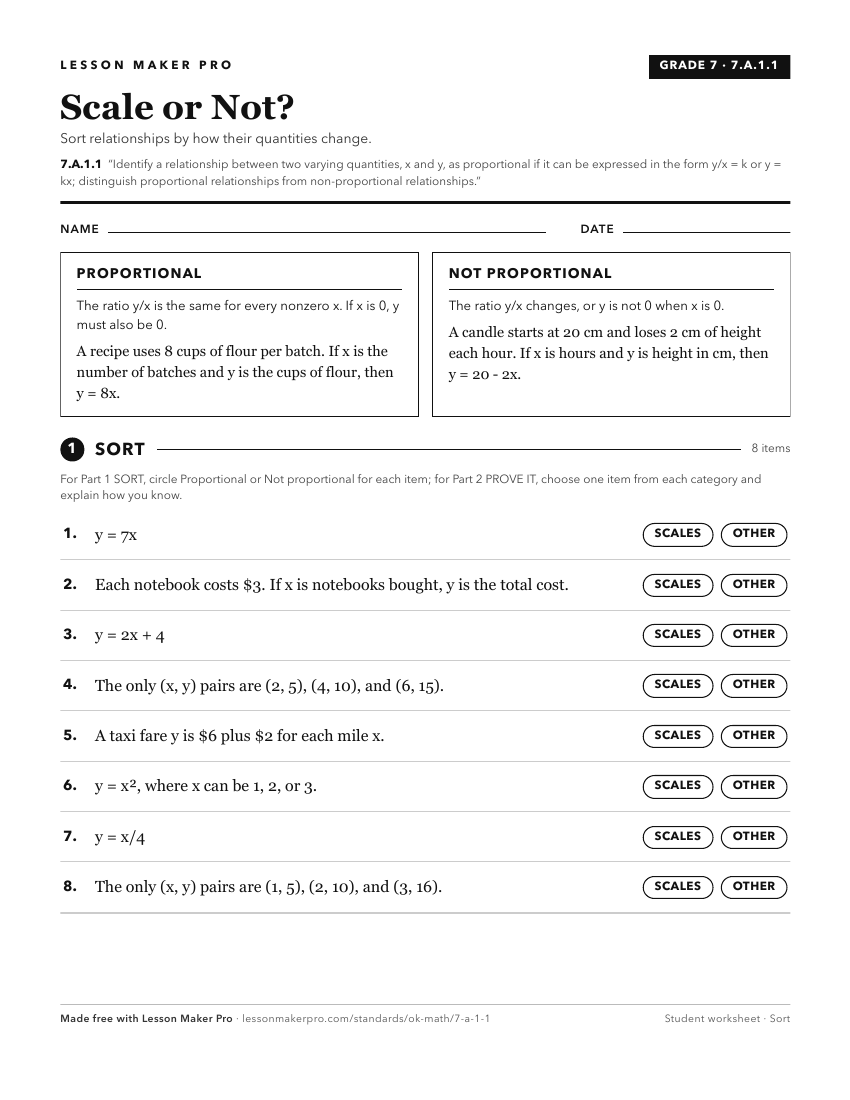
A ready-to-print activity worksheet aligned to 7.A.1.1, with an answer key for the teacher on its own page. No account needed.
PDF, US Letter, prints cleanly in black and white.
Download the worksheetKeep exploring
Related Standards
- 7.A.1.2
Recognize that the graph of a proportional relationship is a line through the origin and the coordinate (1, r), where r is the slope and the unit rate (constant...
- 7.A.1
Explain the concept of proportionality in mathematical models and situations and distinguish between proportional and non-proportional relationships.
- 7.A.2.1
Represent proportional relationships with tables, verbal descriptions, symbols, and graphs; translate from one representation to another. Determine and compare ...
- 7.A.2
Identify and justify proportional relationships using mathematical models and situations; solve problems involving proportional relationships and interpret resu...
Turn this exact standard into a lesson
Grade, subject, topic, and the complete standard are prefilled. Create one free, no account needed.
Also for this standard:Make a WorksheetMake a QuizMake a Sub Lesson