NY Social Studies 8.8a
The Standard
After World War II, the United States experienced various shifts in population and demographics that resulted in social, political, and economic consequences.
New York State K–12 Social Studies Framework
Key Idea 8.8
DEMOGRAPHIC CHANGE: After World War II, the population of the United States rose sharply as a result of both natural increases and immigration. Population movements have resulted in changes to the American landscape and shifting political power. An aging population is affecting the economy and straining public resources.
Teacher's field guide
What This Standard Means
What Students Need to Do
- Students trace how the baby boom, suburbanization, and migration to the Sun Belt changed where Americans lived. They explain effects on housing, schools, cities, farmland, political power, Social Security, and health care.
What Mastery Looks Like
- Students use maps, census data, or graphs to identify population shifts. They build accurate cause-and-effect chains, such as Sun Belt growth leading to more congressional seats and electoral votes. They distinguish immediate effects from later effects.
Common Misconceptions
- Students may confuse the baby boom with increased immigration rather than increased births. They may assume suburban growth benefited cities or had no effect on farmland. They may also miss how population shifts change representation and federal spending.
How to Assess It
- Exit ticket: Choose the baby boom, suburbanization, or Sun Belt migration. Name one population change and explain one economic, social, or political effect.
Lesson moves
Ways to Teach It
Give pairs 1940 and 1970 population maps, then have them mark suburban growth, Sun Belt gains, and likely effects with sticky notes.
Write a claim answering: Which postwar population shift changed American life most, and support it with two specific effects.
Run a card sort matching baby boom, suburbanization, and Sun Belt migration to economic, social, and political consequences.
Compare your county's 1950 and current census data, then identify one local change in housing, age, or land use.
Free download
Printable 8.8a Worksheet
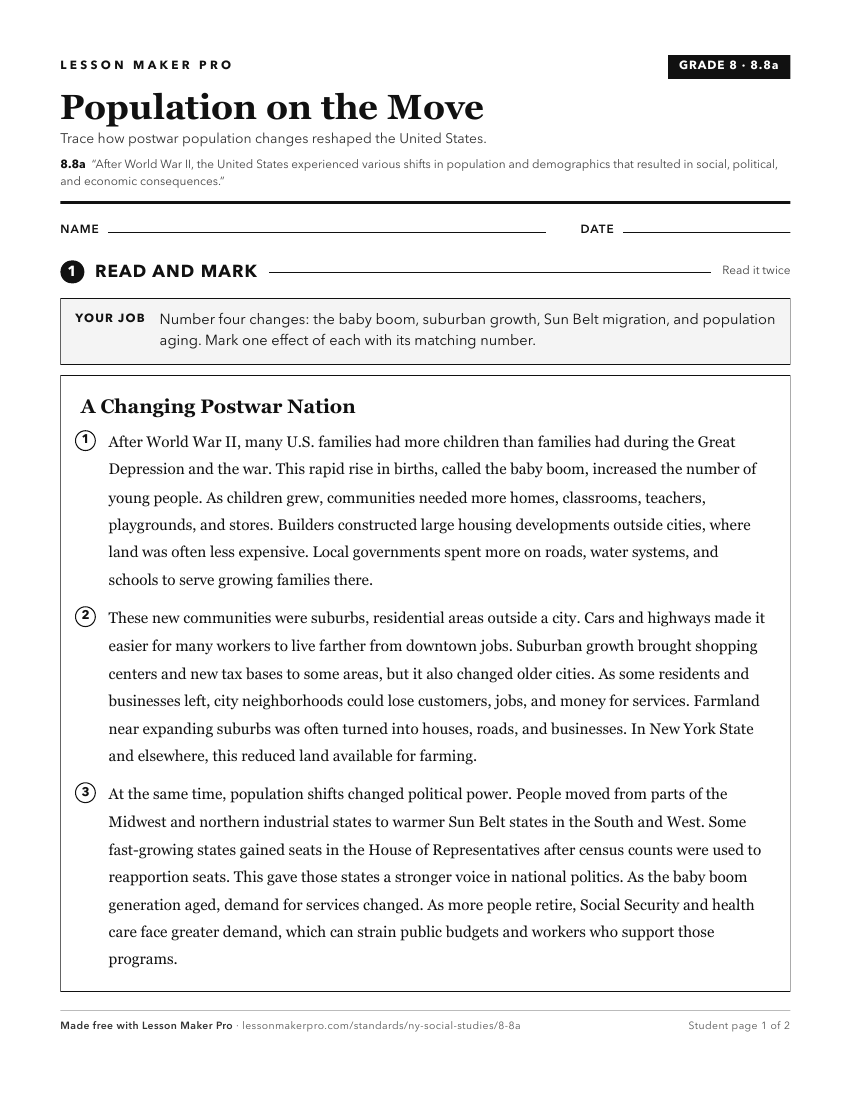
A ready-to-print activity worksheet aligned to 8.8a, with an answer key for the teacher on its own page. No account needed.
PDF, US Letter, prints cleanly in black and white.
Download the worksheetTurn this exact standard into a lesson
Grade, subject, topic, and the complete standard are prefilled. Create one free, no account needed.
Also for this standard:Make a WorksheetMake a QuizMake a Sub Lesson