NY Next Generation Math NY-8.F.4
The Standard
Construct a function to model a linear relationship between two quantities. Determine the rate of change and initial value of the function from a description of a relationship or from two (x, y) values, including reading these from a table or from a graph. Interpret the rate of change and initial value of a linear function in terms of the situation it models, and in terms of its graph or a table of values.
New York State Next Generation Mathematics Learning Standards
Teacher's field guide
What This Standard Means
What Students Need to Do
- Students build a linear equation from a description, two points, a table, or a graph. They determine and interpret the rate of change and initial value in the situation and representation.
What Mastery Looks Like
- From (2, 11) and (5, 23), the student finds a rate of 4 and initial value of 3, then writes y = 4x + 3. The student explains both numbers in context.
Common Misconceptions
- Students may use y divided by x as the rate when the initial value is not zero. They may calculate the rate correctly but treat the intercept as another data point rather than the starting value.
How to Assess It
- A table contains (2, 11) and (5, 23) for hours and total cost. Ask for the linear equation and interpretations of its rate and initial value.
Lesson moves
Ways to Teach It
Build a table from two coordinate cards, draw slope triangles, and extend the line to find its vertical intercept.
Ask students to explain the difference between a rate of change and an initial value in a fee problem.
Play linear-model match with descriptions, point pairs, tables, graphs, and equations.
Model a service with a starting fee and hourly charge, then interpret the equation's two parameters.
Free download
Printable NY-8.F.4 Worksheet
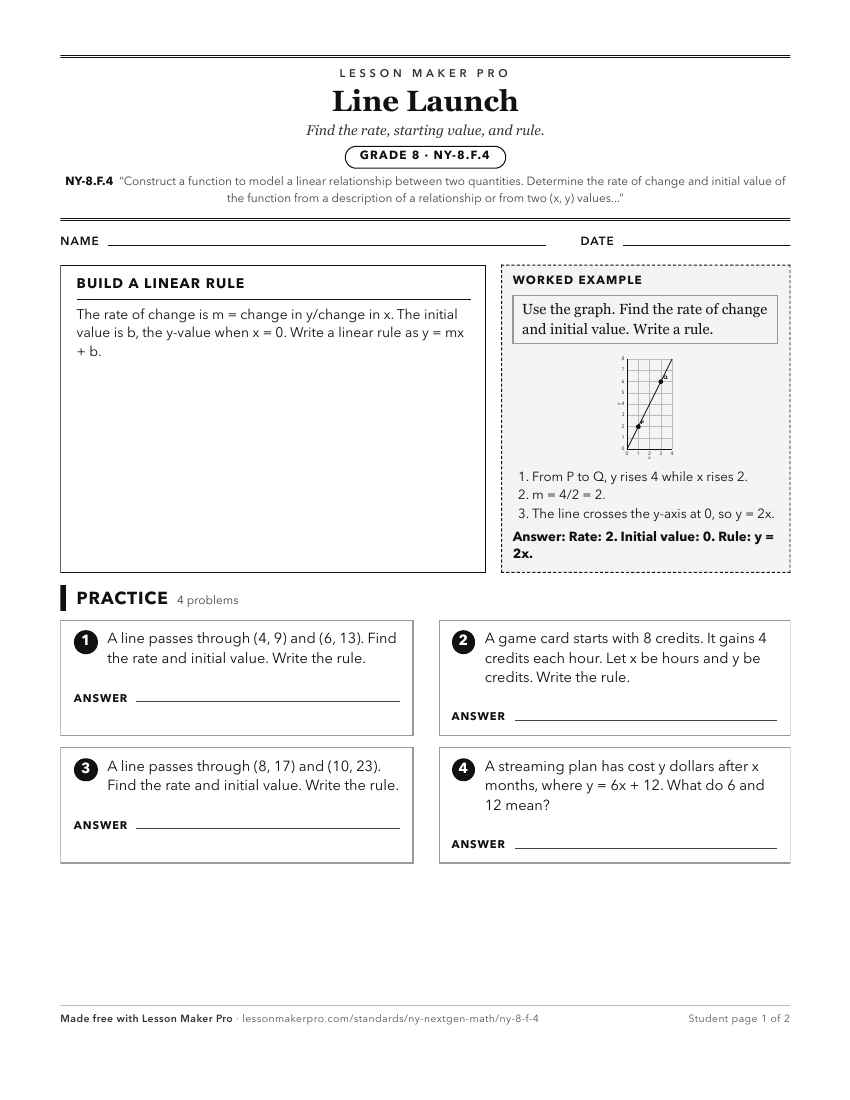
A ready-to-print activity worksheet aligned to NY-8.F.4, with an answer key for the teacher on its own page. No account needed.
PDF, US Letter, prints cleanly in black and white.
Download the worksheetKeep exploring
Related Standards
- NY-6.EE.9
Use variables to represent two quantities in a real-world problem that change in relationship to one another. Given a verbal context and an equation, identify t...
- NY-8.F.5
Describe qualitatively the functional relationship between two quantities by analyzing a graph. Sketch a graph that exhibits the qualitative features of a funct...
- NY-8.EE.5
Graph proportional relationships, interpreting the unit rate as the slope of the graph. Compare two different proportional relationships represented in differen...
Turn this exact standard into a lesson
Grade, subject, topic, and the complete standard are prefilled. Create one free, no account needed.
Also for this standard:Make a WorksheetMake a QuizMake a Sub Lesson