NY Next Generation Math AI-S.ID.8
The Standard
Calculate (using technology) and interpret the correlation coefficient of a linear fit.
New York State Next Generation Mathematics Learning Standards
Teacher's field guide
What This Standard Means
What Students Need to Do
- Students use technology in Algebra I to calculate a linear correlation coefficient. They interpret its sign and magnitude as the direction and strength of a linear association.
What Mastery Looks Like
- The student enters paired data correctly, reports the coefficient, and gives a contextual interpretation. The explanation distinguishes strong association from causation and checks whether a linear pattern is reasonable.
Common Misconceptions
- Students may treat a coefficient near zero as no relationship of any kind or claim correlation proves causation. They may ignore data-entry errors or nonlinear patterns.
How to Assess It
- Provide paired study-time and score data. Ask students to calculate the correlation coefficient with technology and interpret its direction, strength, and causal limits.
Lesson moves
Ways to Teach It
Plot paired-data cards on a large grid and predict the correlation sign before using technology.
Ask students whether a strong correlation supports a causal claim and require a contextual reason.
Play correlation estimate by ranking scatter plots before revealing technology-generated coefficients.
Analyze paired school or community data and report association without claiming unsupported causation.
Free download
Printable AI-S.ID.8 Worksheet
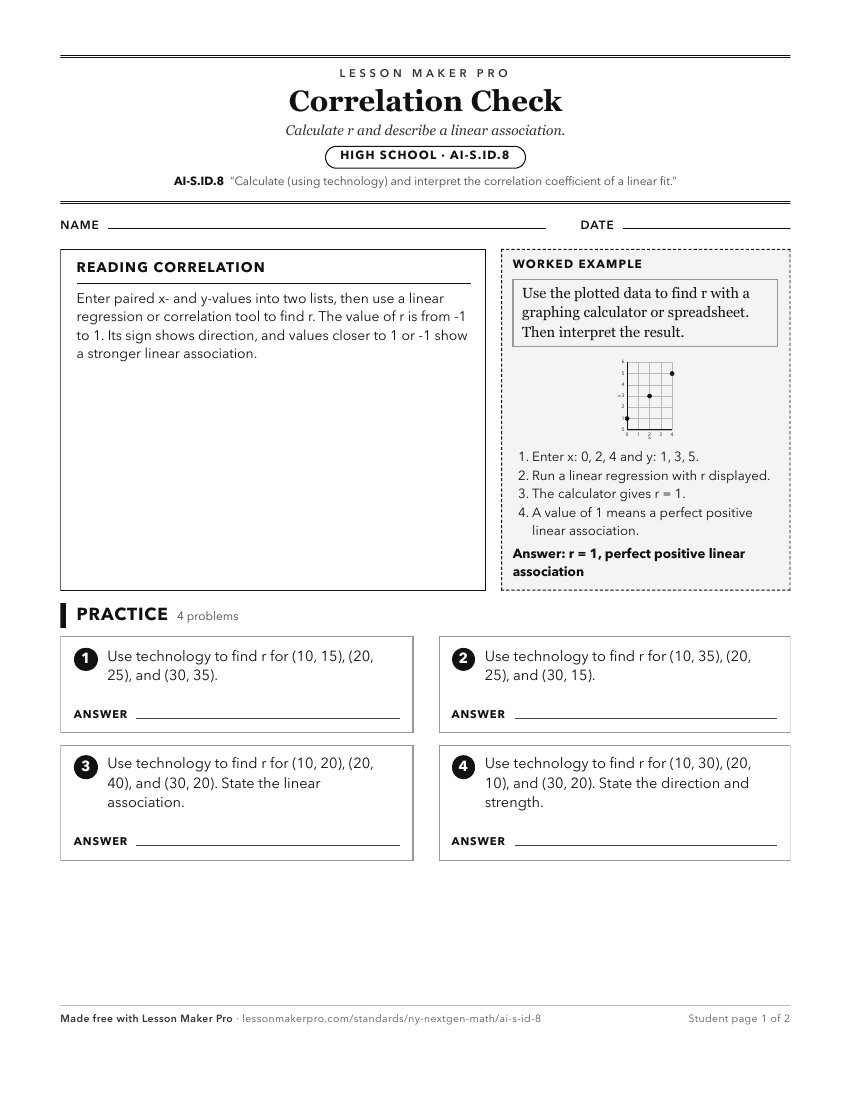
A ready-to-print activity worksheet aligned to AI-S.ID.8, with an answer key for the teacher on its own page. No account needed.
PDF, US Letter, prints cleanly in black and white.
Download the worksheetKeep exploring
Related Standards
- AI-S.ID.7
Interpret the slope (rate of change) and the intercept (constant term) of a linear model in the context of the data.
- NY-8.SP.2
Understand that straight lines are widely used to model relationships between two quantitative variables. For scatter plots that suggest a linear association, i...
- NY-8.SP.3
Use the equation of a linear model to solve problems in the context of bivariate measurement data, interpreting the slope and intercept.
Turn this exact standard into a lesson
Grade, subject, topic, and the complete standard are prefilled. Create one free, no account needed.
Also for this standard:Make a WorksheetMake a QuizMake a Sub Lesson