Montana Math MT.8.F.4
The Standard
Given linear data relating two quantities, construct a linear function that models the data and interpret the rate of change and initial value of a linear function in terms of the situation it models.
2026 Montana Mathematics Content Standards
Teacher's field guide
What This Standard Means
What Students Need to Do
- Students use data from a table or graph to write a linear rule. They find the change in output for each one-unit increase in input. They explain that rate and the value at zero using the units in the problem.
What Mastery Looks Like
- Given rental costs of $11 for 1 hour and $21 for 3 hours, a student writes C = 5h + 6. They explain that each hour adds $5 and the rental starts with a $6 fee.
Common Misconceptions
- Students may subtract two costs but forget to divide by the change in hours. They may call the first cost in a table the starting fee, even when the table begins at 1 hour. Some reverse the input and output when finding the rate.
How to Assess It
- Exit ticket: A scooter rental costs $14 for 2 hours and $26 for 5 hours. Write a cost rule in terms of hours, then state the hourly rate and starting fee.
Lesson moves
Ways to Teach It
Use counters to model a $4 taxi fee plus $2 per mile for 0 to 4 miles; record totals and write the rule.
Show rental costs of $11 for 1 hour and $21 for 3 hours; ask what the hourly rate and starting fee mean.
Give pairs three cost tables; partners race to write a rule for each and label the rate with its units.
Post a sample parking sign: $3 to enter, plus $2 per hour; have students calculate three charges and explain both fees.
Free download
Printable MT.8.F.4 Worksheet
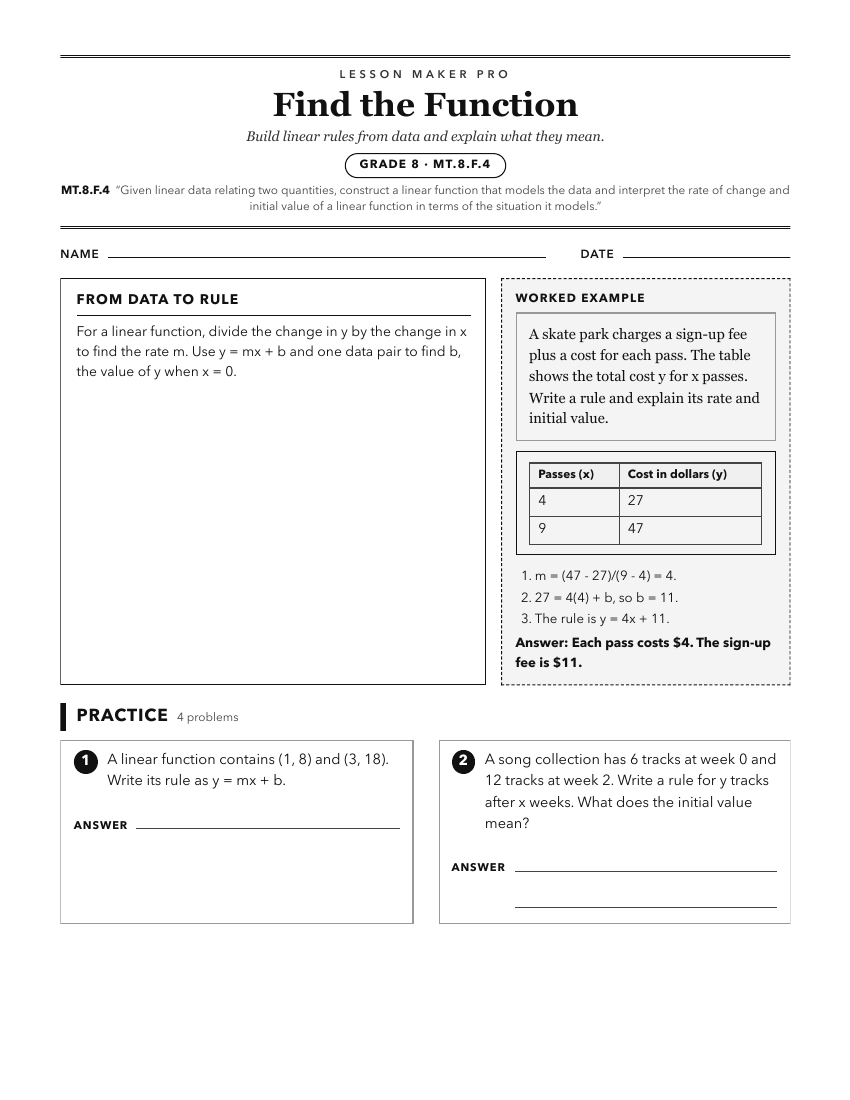
A ready-to-print activity worksheet aligned to MT.8.F.4, with an answer key for the teacher on its own page. No account needed.
PDF, US Letter, prints cleanly in black and white.
Download the worksheetKeep exploring
Related Standards
- MT.5.MD.2
Make a line plot to display a data set of measurements in fractions of a unit and use operations on fractions to solve problems involving information presented ...
- MT.8.EE.5
Graph proportional relationships, interpret the unit rate as the slope of the graph, and compare two different proportional relationships as tables, graphs, and...
Turn this exact standard into a lesson
Grade, subject, topic, and the complete standard are prefilled. Create one free, no account needed.
Also for this standard:Make a WorksheetMake a QuizMake a Sub Lesson