Mississippi Math FA.S.40
The Standard
Without technology, fluently calculate the measures of central tendency (mean, median, mode), measures of spread (range, interquartile range), and understand the impact of extreme values (outliers) on each of these values. (6.SP.5, 8.SP.1, S-ID.3) Justify which measure is appropriate to use when describing a data set or a real-world context.
2025 Mississippi College- and Career-Readiness Standards for Mathematics
Teacher's field guide
What This Standard Means
What Students Need to Do
- Students calculate mean, median, mode, range, and interquartile range by hand. They compare results before and after an extreme value appears, then choose a measure that fits the data.
What Mastery Looks Like
- For 2, 3, 4, 4, 5, 6, 20, a student gets a mean of 44/7, median and mode of 4, range of 18, and IQR of 3. They show that replacing 20 with 7 changes the mean and range, but not the other three measures. They choose the median to describe a typical value in the original list and explain why.
Common Misconceptions
- Students may find the median before sorting or divide by the wrong count when finding the mean. Some confuse IQR with the full range or assume an outlier changes every measure. Others assume outliers can never affect the IQR or mode.
How to Assess It
- Exit ticket: For 4, 5, 6, 6, 7, 8, 34, calculate all five measures by hand. Replace 34 with 9, list which measures change, and explain whether mean or median better describes the original list.
Lesson moves
Ways to Teach It
Give pairs number cards labeled 2, 3, 4, 4, 5, 6, 7; swap 7 for 20 and recalculate all five measures by hand.
Ask: Six houses cost about $250,000, and one costs $2 million. Should an agent report mean or median price? Why?
Run a calculation relay with 1, 2, 2, 3, 4, 5, 11; teams race to find all five measures by hand.
Post bus wait times of 3, 4, 4, 5, 6, 7, and 25 minutes; ask which measure describes a typical wait and why.
Free download
Printable FA.S.40 Worksheet
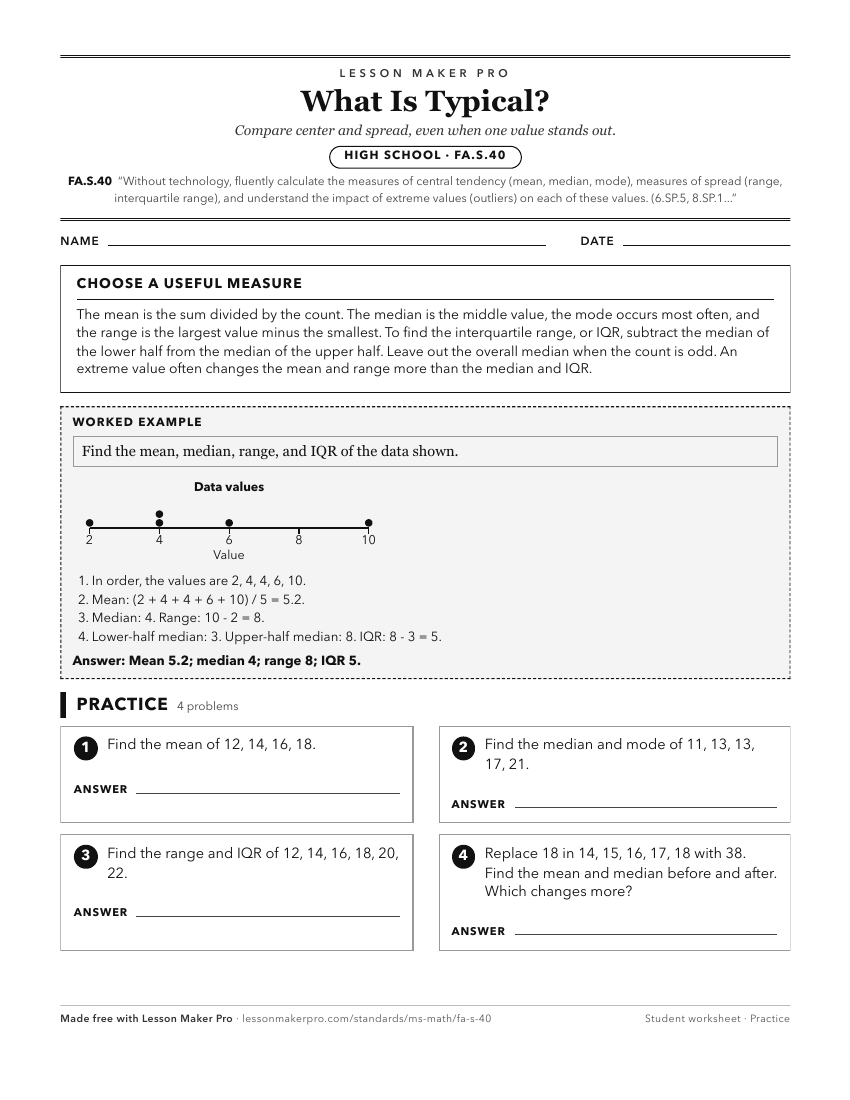
A ready-to-print activity worksheet aligned to FA.S.40, with an answer key for the teacher on its own page. No account needed.
PDF, US Letter, prints cleanly in black and white.
Download the worksheetKeep exploring
Related Standards
- 7.SP.4
Use measures of center and measures of variability (i.e., inter-quartile range) for numerical data from random samples to draw informal comparative inferences a...
- 6.SP.5c
Giving quantitative measures of center (median and/or mean) and variability (interquartile range), as well as describing any overall pattern and any striking de...
Turn this exact standard into a lesson
Grade, subject, topic, and the complete standard are prefilled. Create one free, no account needed.
Also for this standard:Make a WorksheetMake a QuizMake a Sub Lesson