Mississippi Math F-IF.4
The Standard
For a function that models a relationship between two quantities, interpret key features of graphs and tables in terms of the quantities, and sketch graphs showing key features given a verbal description of the relationship. Key features include: intercepts; intervals where the function is increasing, decreasing, positive, or negative; relative maximums and minimums; symmetries; and end behavior. *
2025 Mississippi College- and Career-Readiness Standards for Mathematics · Interpret Functions that Arise in Applications in Terms of Context
Teacher's field guide
What This Standard Means
What Students Need to Do
- Students read graphs and tables as stories about two changing quantities. They explain what zeros, positive and negative values, rising and falling stretches, peaks, valleys, symmetry, and end trends mean in the situation. They also sketch a graph from a written description.
What Mastery Looks Like
- A student can identify when a quantity is zero, rising, or falling and explain the answer with units. They can point out a high or low point, recognize symmetry when it appears, and describe where the graph is headed at each end. Their sketch shows the events in the right order.
Common Misconceptions
- Students may call a function increasing just because its values are positive. They may confuse the starting value with the time when the value reaches zero, or mistake a nearby peak for the highest value anywhere. Some extend a graph beyond the times the situation allows.
How to Assess It
- Exit ticket: A tank starts with 20 gallons, fills to 50 gallons in two hours, stays there for one hour, then drains to zero in three hours. Sketch gallons against time, label the starting value and high point, and mark when the amount rises, stays steady, and falls.
Lesson moves
Ways to Teach It
Use a toy car, tape measure, and timer to record its distance from a wall as it rolls toward the wall and back.
Show a graph above the x-axis but sloping down; ask, “How can the value be positive while the function decreases?”
Give teams graph, table, and story cards for a school fundraiser; have them match the cards and explain each peak.
Use a phone battery chart to mark charging intervals and discuss why the rising trend cannot continue past 100 percent.
Free download
Printable F-IF.4 Worksheet
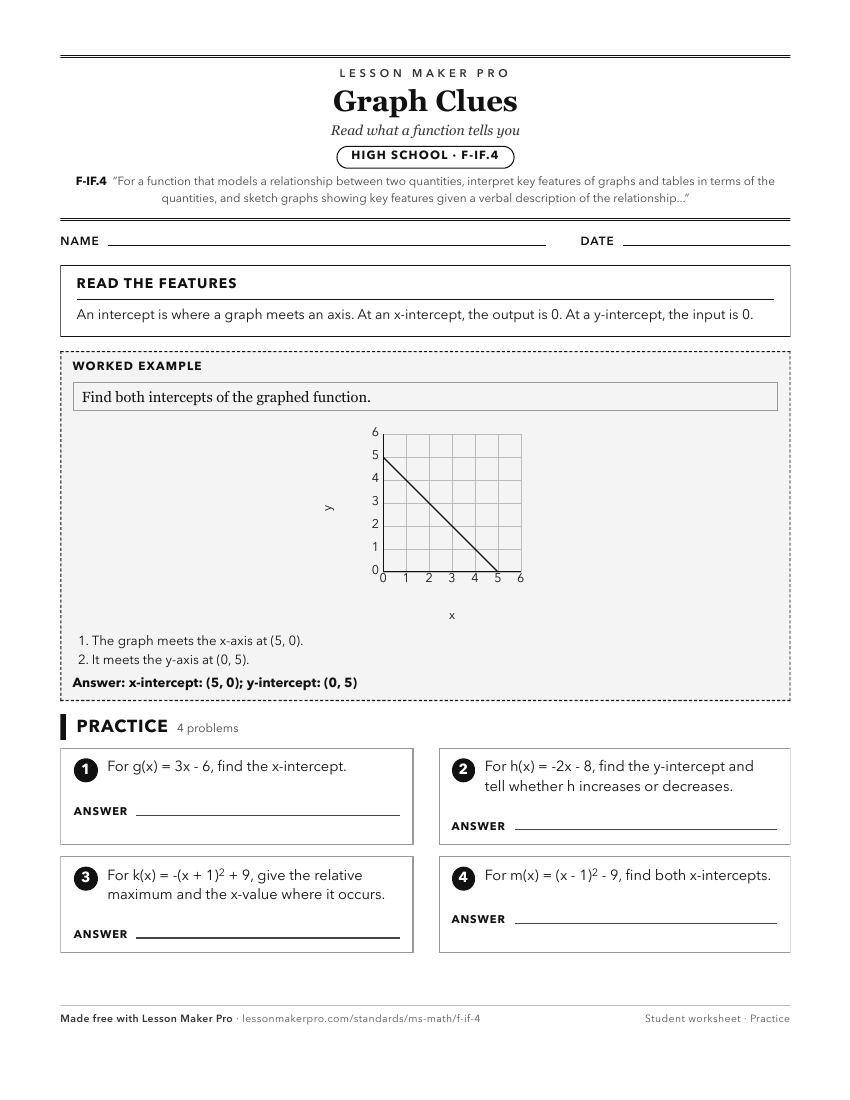
A ready-to-print activity worksheet aligned to F-IF.4, with an answer key for the teacher on its own page. No account needed.
PDF, US Letter, prints cleanly in black and white.
Download the worksheetKeep exploring
Related Standards
- C.A.4
Predict and explain the characteristics and behavior of functions and their graphs (domain, range, increasing/decreasing intervals, intercepts, symmetry, and en...
- ATM.F.32
Construct linear functions, given a graph, a description of a relationship, or two input-output pairs (include reading these from a table).
Turn this exact standard into a lesson
Grade, subject, topic, and the complete standard are prefilled. Create one free, no account needed.
Also for this standard:Make a WorksheetMake a QuizMake a Sub Lesson