Maryland Math 8.DS.B.3
The Standard
Compare the fit of different linear models shown on scatter plots of the same data by describing the overall pattern and the closeness of data points to each line.
Maryland College and Career Ready Standards for Mathematics (2025) · DESCRIBE, ANALYZE, AND COMPARE DATA USING VISUAL AND NUMERICAL REPRESENTATIONS TO MODEL SITUATIONS AND DRAW INFERENCES.
Teacher's field guide
What This Standard Means
What Students Need to Do
- Students compare two lines drawn on the same scatter plot. They describe the pattern in the dots and decide which line stays closer to the dots overall.
What Mastery Looks Like
- A student can name the trend, such as scores rising as study time rises. They can choose the better line and point to dots that are much farther from the other line.
Common Misconceptions
- Students may pick the steeper line because it looks more dramatic. They may focus on one dot that a line crosses and ignore how far that line sits from the other dots.
How to Assess It
- Have students plot (1,2), (2,3), (3,3), and (4,5), then draw y = x + 1 and y = 2x. Ask which line fits better and why, using the pattern and the gaps between dots and lines.
Lesson moves
Ways to Teach It
Give pairs a printed scatter plot of study time and quiz scores; place two colored strings across the dots and compare the gaps.
Show two lines on one scatter plot and ask, "Which line follows the trend and stays closer to most dots? Name one exception."
Deal pairs cards showing the same dots with three different lines; have them rank the lines by fit and defend their choices.
Plot bike trips of 1, 2, 3, 4 miles in 6, 12, 16, 23 minutes; draw two lines, compare gaps, predict 5 miles.
Free download
Printable 8.DS.B.3 Worksheet
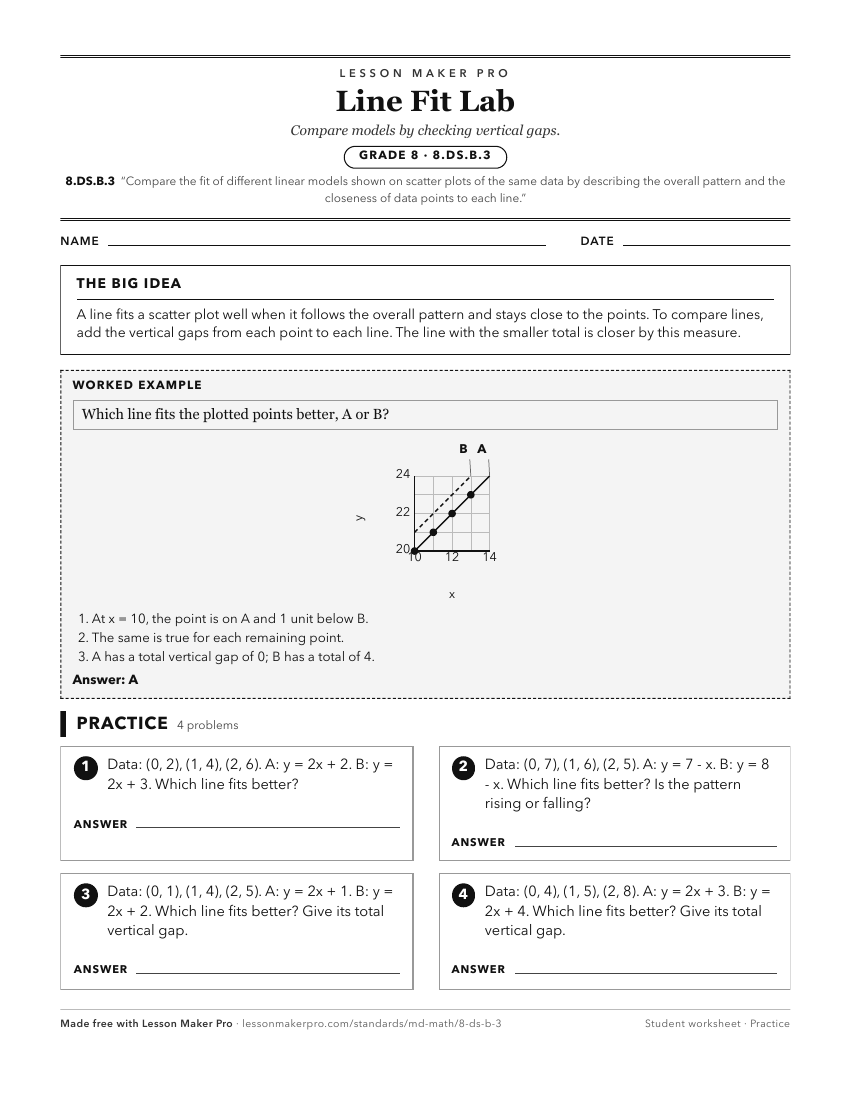
A ready-to-print activity worksheet aligned to 8.DS.B.3, with an answer key for the teacher on its own page. No account needed.
PDF, US Letter, prints cleanly in black and white.
Download the worksheetKeep exploring
Related Standards
- 7.DS.B.3.a
Use histograms and other visualizations to describe similarities and differences in the range, shape, and clustering of the data sets.
- 8.AT.C.7
Compare the properties (i.e., rate of change, intercepts) of two linear functions each represented in a different way (algebraically, graphically, numerically i...
- 8.DS.A.1.b
Identify limitations or potential bias in data collection or interpretation when analyzing trends in scatter plots.
Turn this exact standard into a lesson
Grade, subject, topic, and the complete standard are prefilled. Create one free, no account needed.
Also for this standard:Make a WorksheetMake a QuizMake a Sub Lesson