Maryland Math 7.DS.B.3.c
The Standard
- 7.DS.B.3
- Compare two numerical data distributions using visual displays and numerical measures to draw inferences about differences between populations.
Use both visual and numerical comparisons to describe how different the two groups are and whether the difference is meaningful in the context of the data.
Maryland College and Career Ready Standards for Mathematics (2025) · DESCRIBE, ANALYZE, AND COMPARE DATA USING VISUAL AND NUMERICAL REPRESENTATIONS TO MODEL SITUATIONS AND DRAW INFERENCES.
Teacher's field guide
What This Standard Means
What Students Need to Do
- Students show two groups on the same scale. They compare medians, spread, and overlap, then decide whether the difference matters in the situation.
What Mastery Looks Like
- A student reads two dot plots, reports each group's median and range, and points out where the values overlap. They use that evidence to explain whether the gap would affect a choice, such as which bus route to take.
Common Misconceptions
- Students may think a higher median means every value in that group is higher. They may focus on the highest value and miss the overlap, or call a small gap meaningful without considering the spread.
How to Assess It
- Two lunch lines have waits in minutes: A: 3, 4, 5, 6, 7 and B: 4, 5, 6, 7, 8. Draw dot plots, compare medians and overlap, then explain whether choosing A would save much time.
Lesson moves
Ways to Teach It
Place sticky notes for Team A scores (4, 5, 6, 7, 8) and Team B scores (6, 7, 8, 9, 10) on parallel number lines; mark medians and overlap.
Draw dot plots for quiz scores (5, 6, 7, 8, 9) and (6, 7, 8, 9, 10); write whether the median gap matters and why.
Play Claim Check: plot sprint times A (12, 12, 13, 13, 14) and B (13, 14, 14, 15, 15); earn a point for claims backed by medians and overlap.
Compare bus travel times for Route A (8, 9, 10, 11, 12) and Route B (9, 10, 11, 12, 13); use plots and medians to judge whether switching saves time.
Free download
Printable 7.DS.B.3.c Worksheet
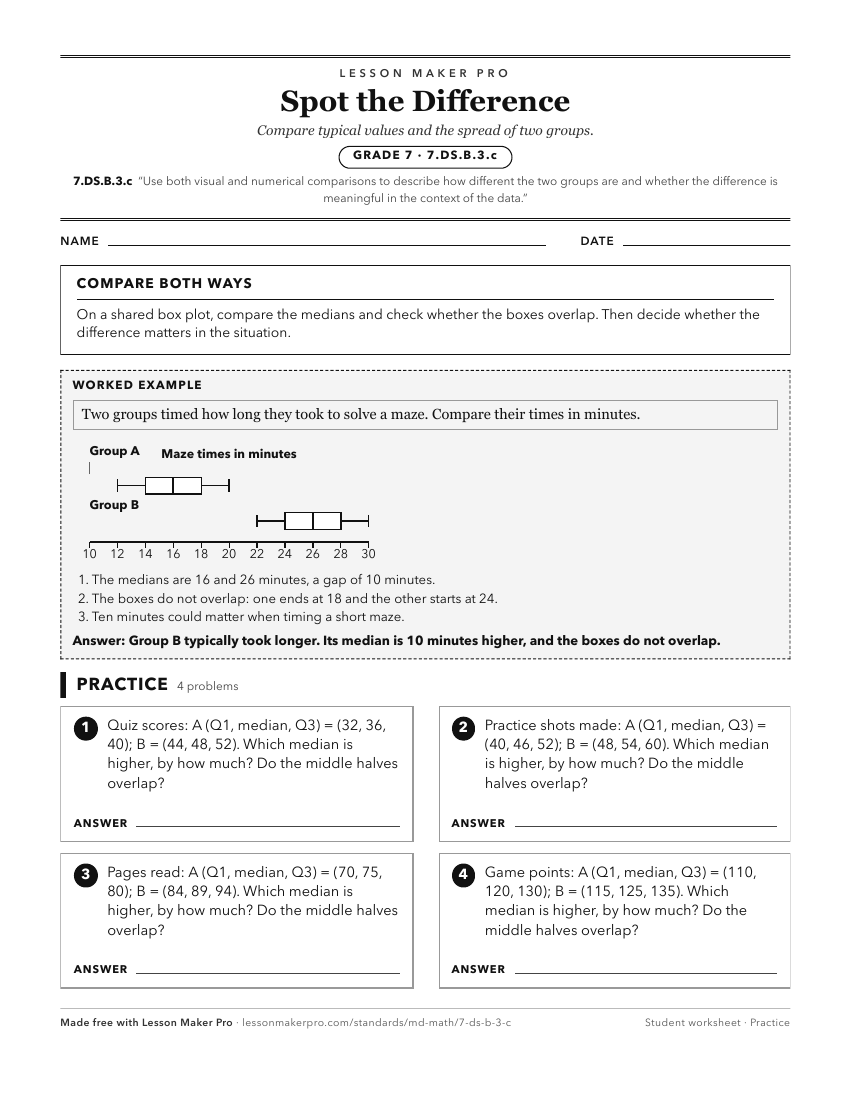
A ready-to-print activity worksheet aligned to 7.DS.B.3.c, with an answer key for the teacher on its own page. No account needed.
PDF, US Letter, prints cleanly in black and white.
Download the worksheetKeep exploring
Related Standards
- 4.DS.A.1.c
Compare and contrast different data visualizations of the same data by varying attributes (e.g., reordering bars, changing the scale) and explain how changing t...
- 7.DS.B.3.a
Use histograms and other visualizations to describe similarities and differences in the range, shape, and clustering of the data sets.
- 7.DS.B.3
Compare two numerical data distributions using visual displays and numerical measures to draw inferences about differences between populations.
Turn this exact standard into a lesson
Grade, subject, topic, and the complete standard are prefilled. Create one free, no account needed.
Also for this standard:Make a WorksheetMake a QuizMake a Sub Lesson