Indiana Social Studies E.5.2
The Standard
Explain the limitations of using GDP to measure economic welfare. Compare the different types of GDP and (nominal, per capita, real) explain the strengths and limitations of each.
2026 Indiana Academic Standards: K-12 Social Studies · Students explain that because resources are limited, people must make choices, understanding the role that supply, demand, prices, and profits play in a market economy. Key elements of the course include study of scarcity and economic reasoning, supply and demand, market structures, the role of government, national economic performance, the role of financial institutions, economic stabilization, and trade.
Teacher's field guide
What This Standard Means
What Students Need to Do
- Students compare GDP at current prices, GDP adjusted for inflation, and GDP per person. They explain what each number shows and why none tells the whole story of how people live.
What Mastery Looks Like
- Given output, prices, and population for two years, students can tell whether GDP rose because of higher prices or more production. They can calculate GDP per person and explain why that average can hide unequal incomes.
Common Misconceptions
- Students may treat rising GDP at current prices as proof that more goods were made, even when only prices rose. They may think GDP per person describes a typical household, or that GDP subtracts pollution damage and counts unpaid care.
How to Assess It
- Exit ticket: GDP at current prices rises from $100 billion to $110 billion, prices rise 10%, and population rises from 10 million to 11 million. What happen to inflation-adjusted GDP and GDP per person, and what is one change in people's lives these figures could miss?
Lesson moves
Ways to Teach It
Give pairs bike sales cards: 10 bikes at $100, then 10 at $120; use populations of 10 and 12 to calculate three GDP measures.
Ask students: If GDP per person rises while a river becomes polluted, did people's lives improve? Write two sentences defending your answer.
Run a four-card quiz: teams decide how inflation, population growth, unpaid care, and pollution affect each GDP measure.
Give students World Bank GDP and GDP-per-person figures for India and Norway; ask which country ranks higher on each and what each figure hides.
Free download
Printable E.5.2 Worksheet
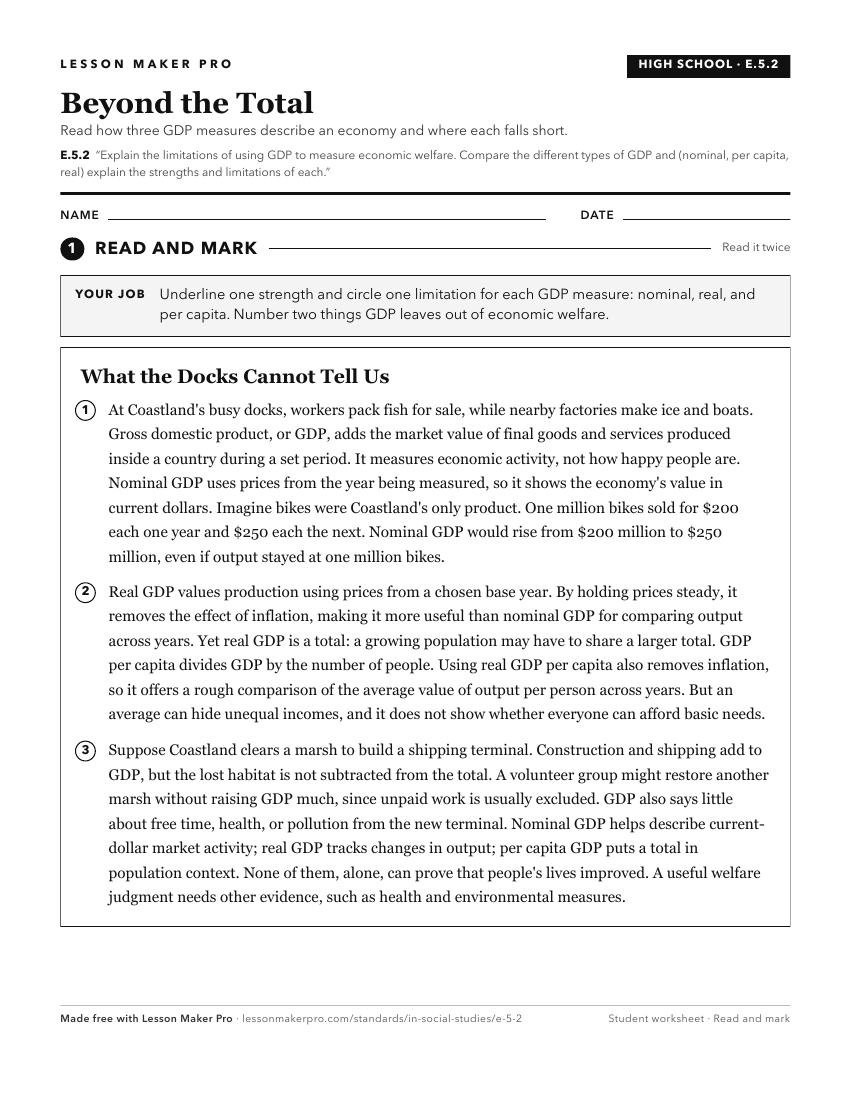
A ready-to-print activity worksheet aligned to E.5.2, with an answer key for the teacher on its own page. No account needed.
PDF, US Letter, prints cleanly in black and white.
Download the worksheetKeep exploring
Related Standards
- GE.1.6
Explain measures of a country's economic performance such as Gross Domestic Product (GDP), unemployment, and inflation.
- GE.2.3
Evaluate the strengths and weaknesses of various economic systems.
- GE.5.7
Investigate the effect of Gross Domestic Product (GDP), unemployment, and inflation on economies.
- E.5.1
Explain measures of a country's economic performance such as gross domestic product (GDP), unemployment, and inflation.
Turn this exact standard into a lesson
Grade, subject, topic, and the complete standard are prefilled. Create one free, no account needed.
Also for this standard:Make a WorksheetMake a QuizMake a Sub Lesson