Alabama Social Studies SS24.E.4
Standard Cluster
Draw conclusions about how supply, demand, and price interact in a market economy. 4a Utilize circular flow diagrams to illustrate and explain the operation of the product market; the operation of the factor market; the real flow of goods and services between and among businesses, households, and government; and the flow of money. 4b Apply the law of supply and demand to everyday consumer and business decisions. 4c Explain how prices serve as incentives in a market economy, and how factors other than price cause changes in supply and demand. 4d Illustrate and explain how supply and demand determine equilibrium price and quantity and how price movements eliminate shortages and surpluses.
2024 Alabama Course of Study: Social Studies
Cluster contents
Standards in This Cluster
SS24.E.4 is a cluster heading. These are the individual standards under it.
- SS24.E.4a
Utilize circular flow diagrams to illustrate and explain the operation of the product market; the operation of the factor market; the real flow of goods and ser...
- SS24.E.4b
Apply the law of supply and demand to everyday consumer and business decisions.
- SS24.E.4c
Explain how prices serve as incentives in a market economy, and how factors other than price cause changes in supply and demand.
- SS24.E.4d
Illustrate and explain how supply and demand determine equilibrium price and quantity and how price movements eliminate shortages and surpluses.
Teacher's field guide
What This Cluster Means
What Students Need to Do
- Students trace goods, labor, services, and money among households, businesses, and government through product and factor markets. They use supply and demand graphs to find equilibrium price and quantity. They explain how prices affect choices and how costs or tastes shift supply or demand.
What Mastery Looks Like
- A student can show who provides labor, who sells goods, and which way payments move, including a government purchase or tax. On a graph, they can mark equilibrium, identify a shortage or surplus at a given price, and show how price adjusts. They can tell a price change from a shift caused by production costs or consumer tastes.
Common Misconceptions
- Students often put wages in the product market or draw goods and money moving in the same direction. They may treat a higher price as a shift of the demand curve rather than a move along it. They may think every shortage means supply decreased, even when the price is simply below equilibrium.
How to Assess It
- On a half-sheet, draw households, firms, and government with arrows labeled labor, goods, wages, purchases, and taxes. Then graph an increase in demand, mark the old and new equilibrium points, and explain whether the old price now creates a shortage or surplus.
Lesson moves
Ways to Teach It
Have pairs use string and role cards to link households, firms, and government through product and factor markets, labeling goods, labor, and money.
Ask students to explain why an orange freeze creates empty shelves at the old price and how a higher price changes buyer choices.
Give teams supply and demand schedules for muffins; call out prices and award points for identifying shortages, surpluses, and equilibrium price.
Show two dated grocery flyers; have students find a changed price and propose a possible nonprice cause, labeled as a guess.
Free download
Printable SS24.E.4 Worksheet
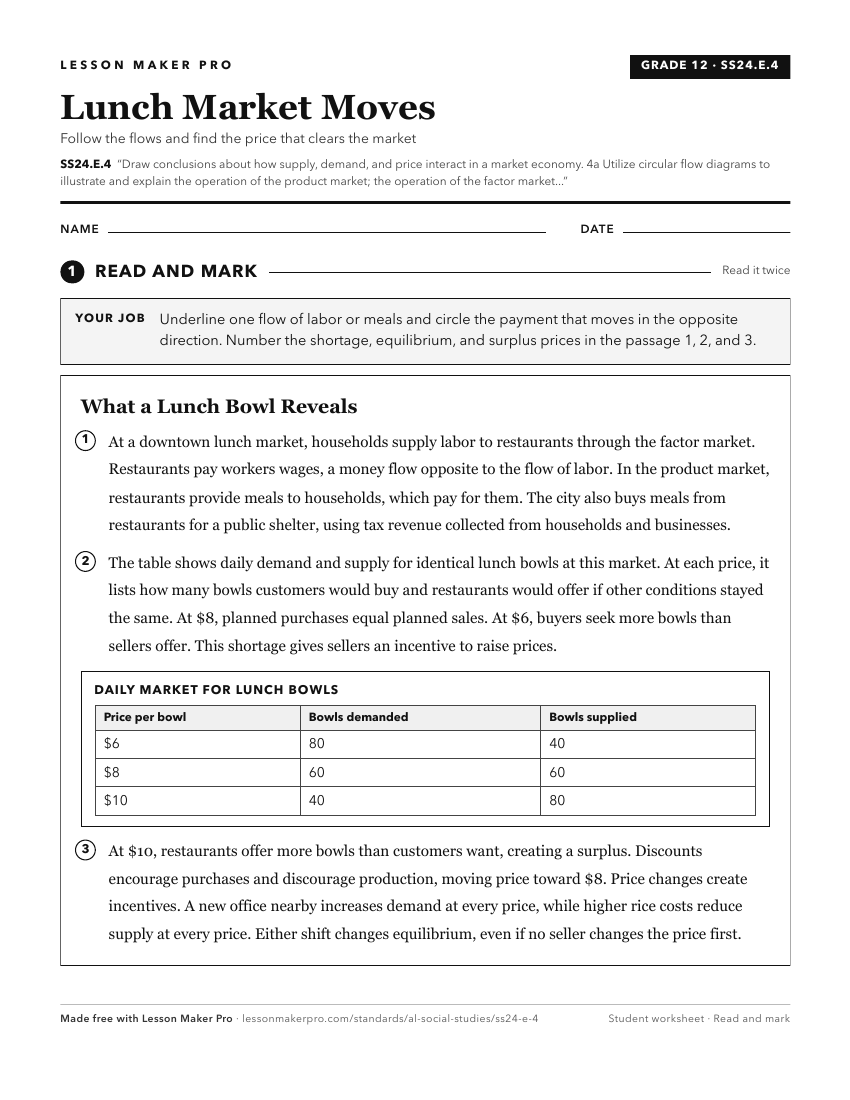
A ready-to-print activity worksheet aligned to SS24.E.4, with an answer key for the teacher on its own page. No account needed.
PDF, US Letter, prints cleanly in black and white.
Download the worksheetKeep exploring
Related Standards
Turn this cluster into a lesson
Grade, subject, topic, and the complete cluster are prefilled. Create one free, no account needed.
Also for this cluster:Make a WorksheetMake a QuizMake a Sub Lesson