Alabama Science ES.8
Standard Cluster
Construct or revise a claim based on evidence of the effects of human activities on Earth’s systems, natural resources, and ecosystem services. a. Evaluate published information from computational models which illustrate the effects of an increase in atmospheric carbon dioxide on photosynthesis and the effect of ocean acidification on marine populations. b. Use engineering practices to evaluate and refine a current solution designed to protect natural resources from anthropogenic sources of atmospheric, terrestrial, or aquatic pollution.
2023 Alabama Course of Study: Science · Earth and Human Activity
Cluster contents
Standards in This Cluster
ES.8 is a cluster heading. These are the individual standards under it.
- ES.8.a
Evaluate published information from computational models which illustrate the effects of an increase in atmospheric carbon dioxide on photosynthesis and the eff...
- ES.8.b
Use engineering practices to evaluate and refine a current solution designed to protect natural resources from anthropogenic sources of atmospheric, terrestrial...
Teacher's field guide
What This Cluster Means
What Students Need to Do
- Students use published model graphs to judge claims about how rising carbon dioxide affects plant growth and how ocean acidification affects marine populations. They check what the models assume. They use pollution data to improve an existing way to protect a natural resource.
What Mastery Looks Like
- A student cites numbers from model graphs and identifies a limit of each prediction. They explain why extra carbon dioxide may not raise plant growth when water is scarce, and link lower ocean pH to changes in shellfish numbers. They use pollution measurements to justify a change to an existing protection method.
Common Misconceptions
- Students may assume extra carbon dioxide always makes plants grow faster, even without enough water or nutrients. They may think ocean acidification means the ocean becomes strongly acidic, or mistake a model prediction for a measurement. They may call a pollution control successful without checking the results.
How to Assess It
- Give students published model graphs of plant growth under rising carbon dioxide and shellfish numbers under falling ocean pH. Add nitrate readings of 8 mg/L above a planted stream buffer and 7 mg/L below it. Ask: “What claim does each graph support, what is one model limit, and how would you improve the buffer?”
Lesson moves
Ways to Teach It
Pour water over two soil trays, one with a sod strip, and compare runoff cloudiness in clear cups.
Compare published model curves for plant growth under rising carbon dioxide with ample and limited water; write a claim supported by both.
Give pairs cards showing projected ocean pH and shellfish numbers; have them match claims to evidence, then reject an overconfident claim.
Use nitrate readings from a local water report to decide whether a planted stream buffer needs a wider strip, and defend the change.
Free download
Printable ES.8 Worksheet
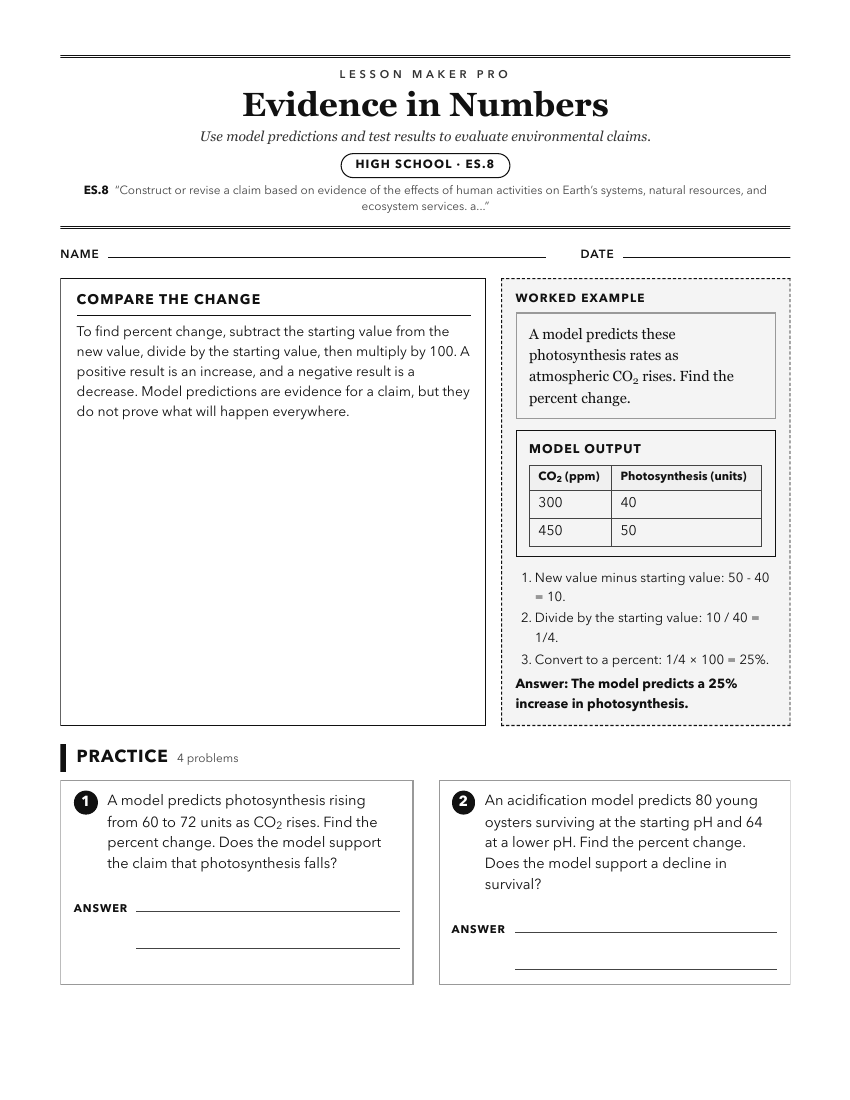
A ready-to-print activity worksheet aligned to ES.8, with an answer key for the teacher on its own page. No account needed.
PDF, US Letter, prints cleanly in black and white.
Download the worksheetKeep exploring
Related Standards
- ES.9
Obtain, evaluate, and communicate information based on evidence to explain how key natural resources, natural hazards, and climate variability influence human a...
- BIO.10
Engage in argument from evidence to support the claim that characteristics of an ecosystem contribute to its resilience and stability, including ecological succ...
- ES.4
Engage in an evidence-based argument to explain how Earth’s systems affect the biosphere and the biosphere affects Earth’s systems over various amounts of time.
- 6.5
Obtain, evaluate, and communicate evidence that explains how constructive and destructive processes shape Earth’s surface.
Turn this cluster into a lesson
Grade, subject, topic, and the complete cluster are prefilled. Create one free, no account needed.
Also for this cluster:Make a WorksheetMake a QuizMake a Sub Lesson