Alabama Math GDA.DSP.C.10.a
The Standard
- GDA.DSP.C
- Distributions of quantitative data (continuous or discrete) in one variable should be described in the context of the data with respect to what is typical (the shape, with appropriate measures of center and variability, including standard deviation) and what is not (outliers), and these characteristics can be used to compare two or more subgroups with respect to a variable.
- GDA.DSP.C.10
- Use statistics appropriate to the shape of the data distribution to compare and contrast two or more data sets, utilizing the mean and median for center and the interquartile range and standard deviation for variability.
Explain how standard deviation develops from mean absolute deviation.
2019 Alabama Course of Study: Mathematics · Distributions of quantitative data (continuous or discrete) in one variable should be described in the context of the data with respect to what is typical (the shape, with appropriate measures of center and variability, including standard deviation) and what is not (outliers), and these characteristics can be used to compare two or more subgroups with respect to a variable.
Teacher's field guide
What This Standard Means
What Students Need to Do
- Students find how far each value is from the mean. They compare two ways to use those distances: average their absolute values for mean absolute deviation, or square them, average them, and take the square root for standard deviation.
What Mastery Looks Like
- Given a short data set, a student can calculate both measures and keep the steps straight. They can explain that squaring gives larger distances more weight, while the square root puts the result back in the data's units.
Common Misconceptions
- Students may add signed distances and get zero, instead of using absolute values or squares. Some stop at the average of the squared distances and call it standard deviation. Others assume the square root makes standard deviation equal to mean absolute deviation.
How to Assess It
- Exit ticket: For the full data set 2, 4, 6, find the mean absolute deviation and standard deviation. Explain why the two answers differ.
Lesson moves
Ways to Teach It
Place counters at 2, 4, and 6 on a number line, then use square tiles to model each squared distance from the mean.
Ask students to write one sentence explaining why a value far from the mean affects standard deviation more than mean absolute deviation.
Give pairs three-number data cards and have them race to complete a table of distances, absolute distances, and squared distances.
Use five days of bus arrival delays to calculate both measures, then identify which day has the largest effect on standard deviation.
Free download
Printable GDA.DSP.C.10.a Worksheet
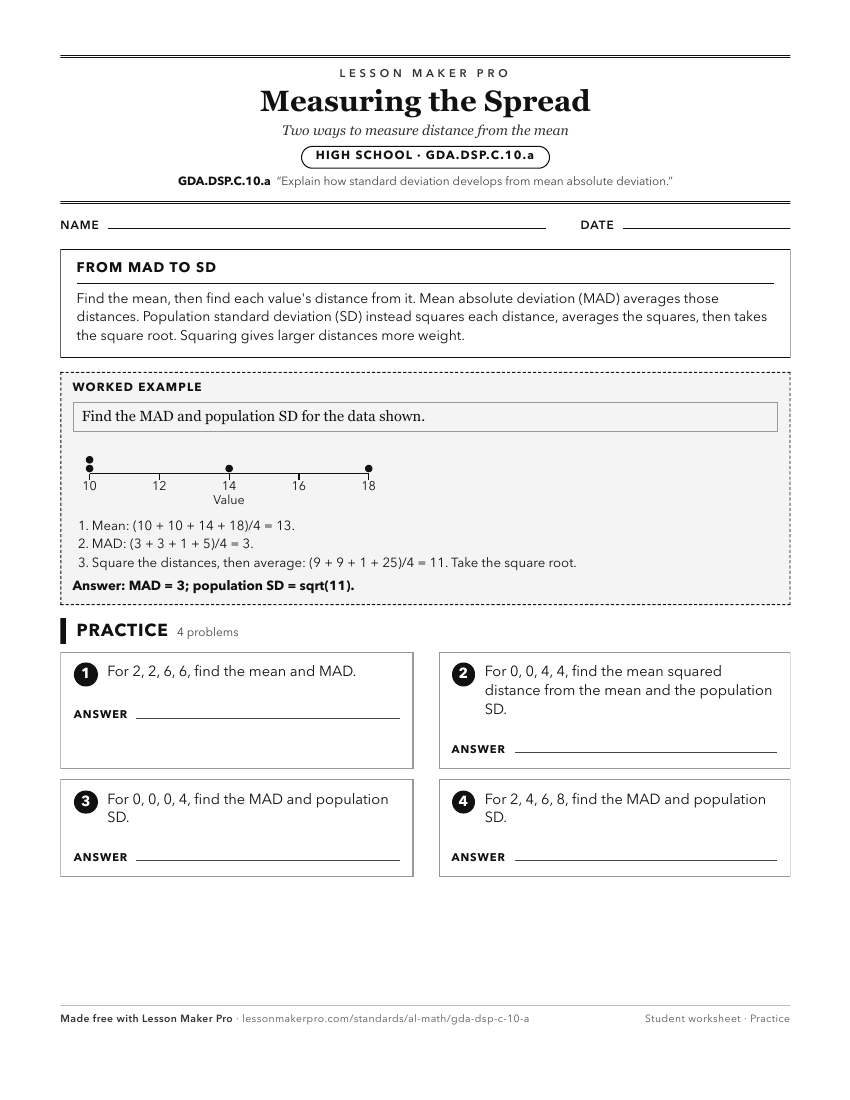
A ready-to-print activity worksheet aligned to GDA.DSP.C.10.a, with an answer key for the teacher on its own page. No account needed.
PDF, US Letter, prints cleanly in black and white.
Download the worksheetKeep exploring
Related Standards
- GDA.DSP.C.11
Interpret differences in shape, center, and spread in the context of data sets, accounting for possible effects of extreme data points (outliers) on mean and st...
- GDA.DSP.C.10.b
Calculate the standard deviation for a data set, using technology where appropriate.
- A2S.DSP.H.31.b
Demonstrate that the standard deviation of each simulated sampling distribution is the known standard deviation of the population divided by the square root of ...
- 7A.DSP.B.28
Make informal comparative inferences about two populations using measures of center and variability and/or mean absolute deviation in context.
Turn this exact standard into a lesson
Grade, subject, topic, and the complete standard are prefilled. Create one free, no account needed.
Also for this standard:Make a WorksheetMake a QuizMake a Sub Lesson