Alabama Math A2S.AF.H.20.f
The Standard
- A2S.AF.H
- Functions can be represented graphically, and key features of the graphs, including zeros, intercepts, and, when relevant, rate of change and maximum/minimum values, can be associated with and interpreted in terms of the equivalent symbolic representation.
- A2S.AF.H.20
- Graph functions expressed symbolically and show key features of the graph, by hand in simple cases and using technology for more complicated cases. Extend to polynomial, trigonometric (sine and cosine), logarithmic, reciprocal, radical, and general piecewise functions.
Compare the graphs of inverse functions and the relationships between their key features, including but not limited to quadratic, square root, exponential, and logarithmic functions.
2019 Alabama Course of Study: Mathematics · Functions can be represented graphically, and key features of the graphs, including zeros, intercepts, and, when relevant, rate of change and maximum/minimum values, can be associated with and interpreted in terms of the equivalent symbolic representation.
Teacher's field guide
What This Standard Means
What Students Need to Do
- Students graph a function and its inverse and check that the graphs reflect across y = x. They compare swapped points, intercepts, domains, and ranges. They restrict a quadratic’s domain before finding its inverse.
What Mastery Looks Like
- A student graphs y = x² for x ≥ 0 and y = √x, then matches (3, 9) with (9, 3). They can also identify the swapped intercepts of an exponential function and its logarithmic inverse.
Common Misconceptions
- Students may reflect a graph across the x-axis instead of y = x. Some confuse an inverse function with 1/f(x). Others use the whole graph of y = x² and assume its inverse is a function.
How to Assess It
- Exit ticket: Graph y = x² for x ≥ 0 and y = √x on the same grid. Label two swapped points and compare the functions’ domains and ranges.
Lesson moves
Ways to Teach It
Plot y = x² for x ≥ 0 on grid paper, fold along y = x, and trace the square root graph.
Ask students to explain why y = x² needs x ≥ 0 before y = √x can be its inverse.
Hand out cards for y = 2^x, y = log₂x, and their graphs; pairs match cards and mark swapped intercepts.
Graph B = 100(1.05)^t and its inverse t(B) on the same grid, then estimate when savings reach $150.
Free download
Printable A2S.AF.H.20.f Worksheet
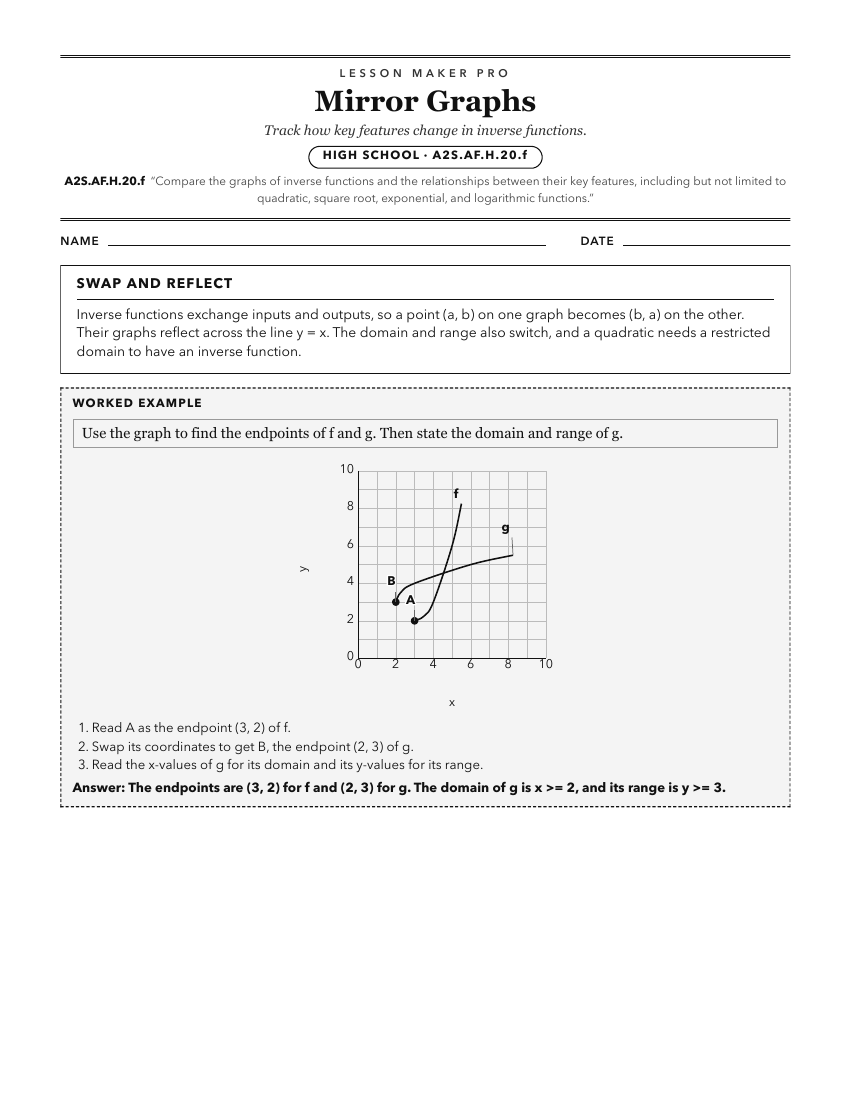
A ready-to-print activity worksheet aligned to A2S.AF.H.20.f, with an answer key for the teacher on its own page. No account needed.
PDF, US Letter, prints cleanly in black and white.
Download the worksheetKeep exploring
Related Standards
- A2S.AF.H.17
For a function that models a relationship between two quantities, interpret key features of graphs and tables in terms of the quantities, and sketch graphs show...
- 8A.AF.J.30
For a function that models a relationship between two quantities, interpret key features of graphs and tables in terms of the quantities, and sketch graphs show...
- A1P.AF.H.28
For a function that models a relationship between two quantities, interpret key features of graphs and tables in terms of the quantities, and sketch graphs show...
- A1P.AF.G.21
Compare properties of two functions, each represented in a different way (algebraically, graphically, numerically in tables, or by verbal descriptions). Extend ...
Turn this exact standard into a lesson
Grade, subject, topic, and the complete standard are prefilled. Create one free, no account needed.
Also for this standard:Make a WorksheetMake a QuizMake a Sub Lesson