Alabama Math 8A.AF.J.30
The Standard
- 8A.AF.J
- Functions can be represented graphically and key features of the graphs, including zeros, intercepts, and, when relevant, rate of change and maximum/minimum values, can be associated with and interpreted in terms of the equivalent symbolic representation.
For a function that models a relationship between two quantities, interpret key features of graphs and tables in terms of the quantities, and sketch graphs showing key features given a verbal description of the relationship. Extend from relationships that can be represented by linear functions to quadratic, exponential, absolute value, and general piecewise functions.
2019 Alabama Course of Study: Mathematics
Teacher's field guide
What This Standard Means
What Students Need to Do
- Read graphs and tables as relationships between two quantities. Explain starting values, zeros, highs, lows, and where values rise, fall, or stay flat. Sketch linear, quadratic, exponential, absolute value, and piecewise graphs from stories.
What Mastery Looks Like
- Given a ball-height graph, a student can identify the greatest height and when the ball reaches the ground. Given a doubling table or a parking-fee rule, they can sketch the curve or step graph and explain its shape.
Common Misconceptions
- Students may mistake a graph’s highest point for the end of the story. They may connect every table entry with straight lines, even when values double or a rule jumps. They may confuse a graph’s height with how fast the quantity changes.
How to Assess It
- Exit ticket: Show this table of hours and bacteria counts: (0, 5), (1, 10), (2, 20), (3, 40). Ask students to sketch a graph and explain its starting value and how the count changes.
Lesson moves
Ways to Teach It
Fill a clear cup, mark water height every ten seconds, then graph the data and label when filling stops.
Show a ball-height graph and ask students to write what its peak and intercepts mean in the story.
Match story, table, and graph cards for steady speed, ball flight, doubling, distance from home, and parking fees.
Use a parking garage’s price-per-started-hour sign; sketch its step graph and explain what happens to cost at each hour.
Free download
Printable 8A.AF.J.30 Worksheet
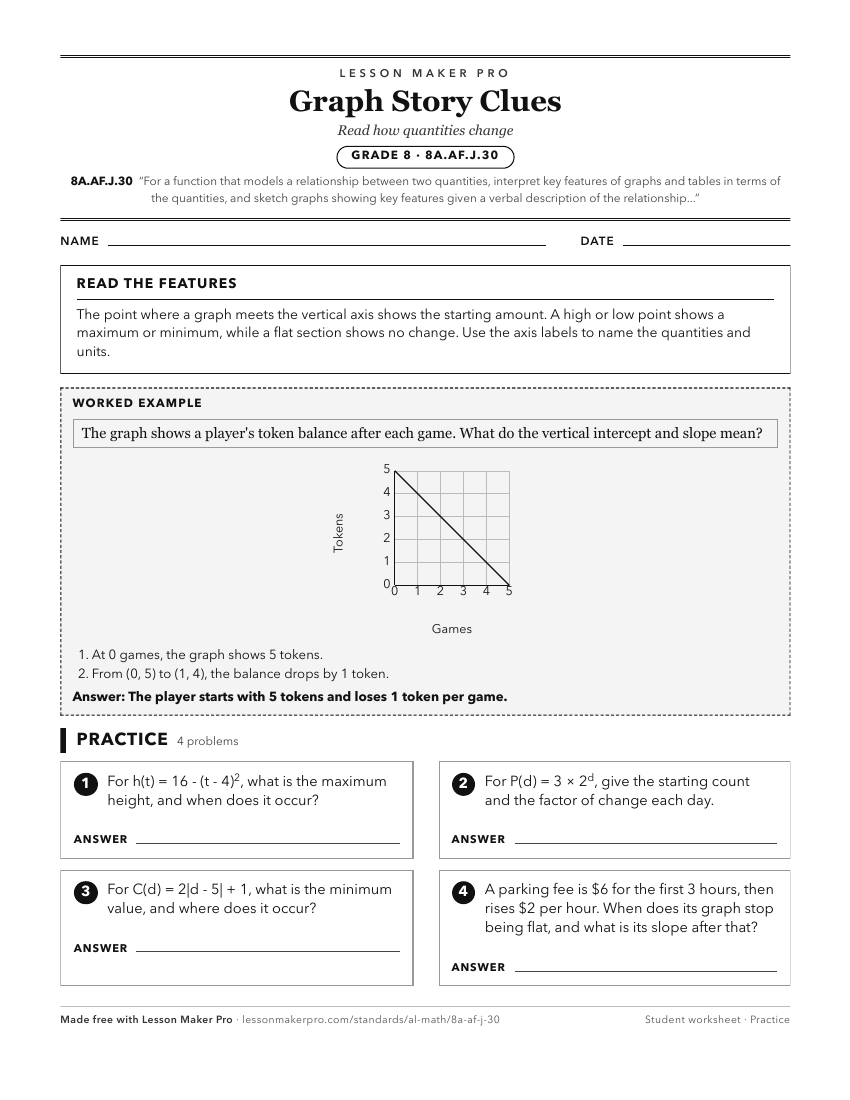
A ready-to-print activity worksheet aligned to 8A.AF.J.30, with an answer key for the teacher on its own page. No account needed.
PDF, US Letter, prints cleanly in black and white.
Download the worksheetKeep exploring
Related Standards
- A1P.AF.H.28
For a function that models a relationship between two quantities, interpret key features of graphs and tables in terms of the quantities, and sketch graphs show...
- A2S.AF.H.17
For a function that models a relationship between two quantities, interpret key features of graphs and tables in terms of the quantities, and sketch graphs show...
Turn this exact standard into a lesson
Grade, subject, topic, and the complete standard are prefilled. Create one free, no account needed.
Also for this standard:Make a WorksheetMake a QuizMake a Sub Lesson