Alabama Math 8A.DSP.B.38
The Standard
- 8A.DSP.B
- Data arise from a context and come in two types: quantitative (continuous or discrete) and categorical. Technology can be used to "clean" and organize data, including very large data sets, into a useful and manageable structure – a first step in any analysis of data.
Distinguish between quantitative and categorical data and between the techniques that may be used for analyzing data of these two types.
2019 Alabama Course of Study: Mathematics
Teacher's field guide
What This Standard Means
What Students Need to Do
- Students tell whether data records amounts or measurements, or names groups. They choose graphs and summaries that fit each type.
What Mastery Looks Like
- Given classmates' commute times and travel methods, a student identifies times as quantitative and methods as categorical. They use a dot plot or median for times, and a bar graph or frequency table for methods.
Common Misconceptions
- Students treat jersey numbers or ZIP codes as quantitative because they contain digits. They may try to find the mean of category labels or use a histogram for categories.
How to Assess It
- Exit ticket: A class records commute time in minutes and travel method. Label each variable as quantitative or categorical, then choose a dot plot or bar graph for each and explain why.
Lesson moves
Ways to Teach It
Hand pairs cards labeled 5, 10, and 15 minutes or bus, car, and walk; sort them, then draw a dot plot and bar graph.
Ask, 'Why does a median make sense for ride times but not for bus, car, and walk?'
Play graph match with cards showing shoe sizes, favorite fruits, daily temperatures, and lunch choices; teams pair each with a dot plot or bar graph.
Use the cafeteria's lunch choice tallies and checkout wait times to make a bar graph and a dot plot, then compare what each shows.
Free download
Printable 8A.DSP.B.38 Worksheet
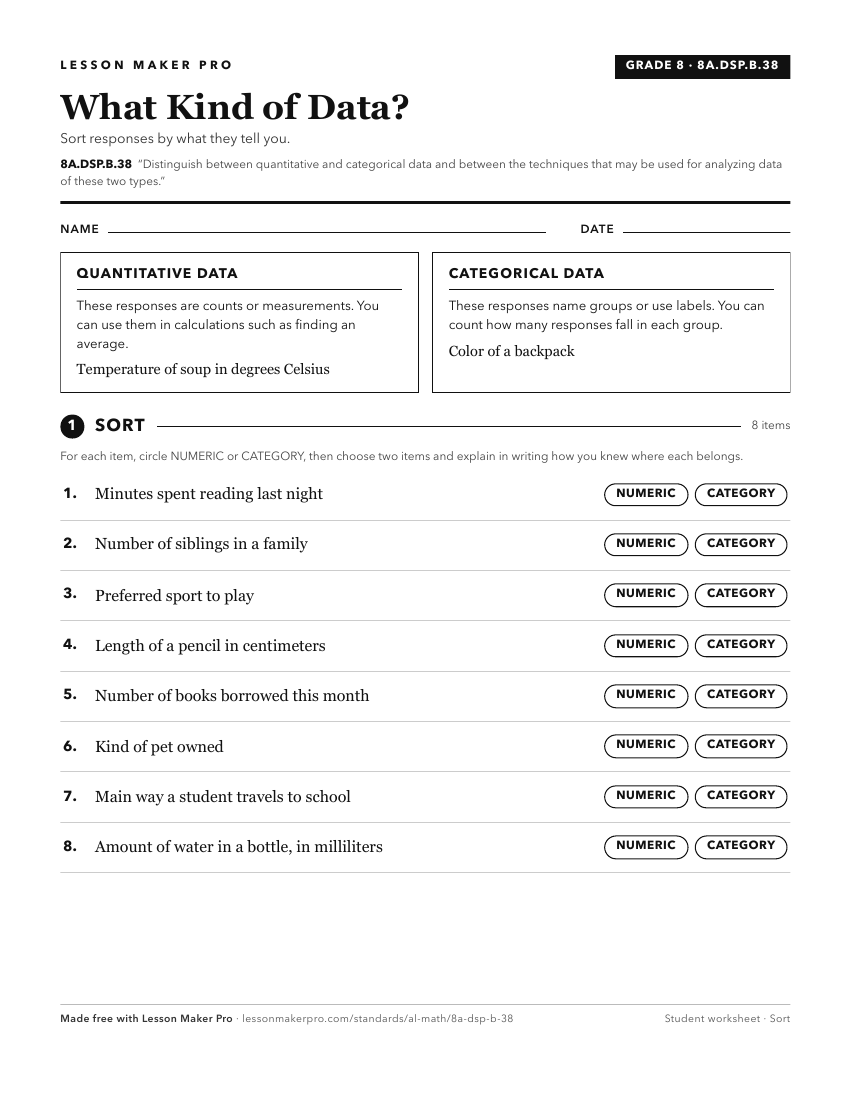
A ready-to-print activity worksheet aligned to 8A.DSP.B.38, with an answer key for the teacher on its own page. No account needed.
PDF, US Letter, prints cleanly in black and white.
Download the worksheetKeep exploring
Related Standards
- A1P.DSP.C.34
Distinguish between quantitative and categorical data and between the techniques that may be used for analyzing data of these two types.
- GDA.DSP.B
Data arise from a context and come in two types: quantitative (continuous or discrete) and categorical. Technology can be used to "clean" and organize data, inc...
- A1P.DSP.C
Data arise from a context and come in two types: quantitative (continuous or discrete) and categorical. Technology can be used to "clean" and organize data, inc...
- 8A.DSP.B
Data arise from a context and come in two types: quantitative (continuous or discrete) and categorical. Technology can be used to "clean" and organize data, inc...
Turn this exact standard into a lesson
Grade, subject, topic, and the complete standard are prefilled. Create one free, no account needed.
Also for this standard:Make a WorksheetMake a QuizMake a Sub Lesson