Alabama Math 8A.AF.I.28
The Standard
- 8A.AF.I
- Functions that are members of the same family have distinguishing attributes (structure) common to all functions within that family.
Use graphs and tables to show that a quantity increasing exponentially eventually exceeds a quantity increasing linearly or quadratically.
2019 Alabama Course of Study: Mathematics
Teacher's field guide
What This Standard Means
What Students Need to Do
- Students make a table and plot three quantities on the same graph. They find where repeated doubling pulls ahead of a steady increase and a squared input.
What Mastery Looks Like
- Students use a table and graph to show that 2^x is above both 10x and x² at x=6 and x=7. They explain why doubling gains ground as x increases.
Common Misconceptions
- Students may think x² is exponential because its graph bends upward. Some read 2^x as 2x or assume the quantity that starts ahead will stay ahead.
How to Assess It
- Exit ticket: Fill a table for 2^x, 10x, and x² at x=5, 6, and 7. Plot the points and circle where 2^x first exceeds both other values in the table.
Lesson moves
Ways to Teach It
Give pairs graph paper and three colored pencils to plot 2^x, 10x, and x² for x=1 through 8.
Ask, “At x=5, 10x leads 2^x. What changes by x=6, and what do you expect at x=7?”
Give pairs cards marked 1 through 8; flip one, calculate 2^x, 10x, and x², and name the largest.
Compare two savings plans on paper: add $10 daily to $0, or double $1 daily; graph balances for eight days.
Free download
Printable 8A.AF.I.28 Worksheet
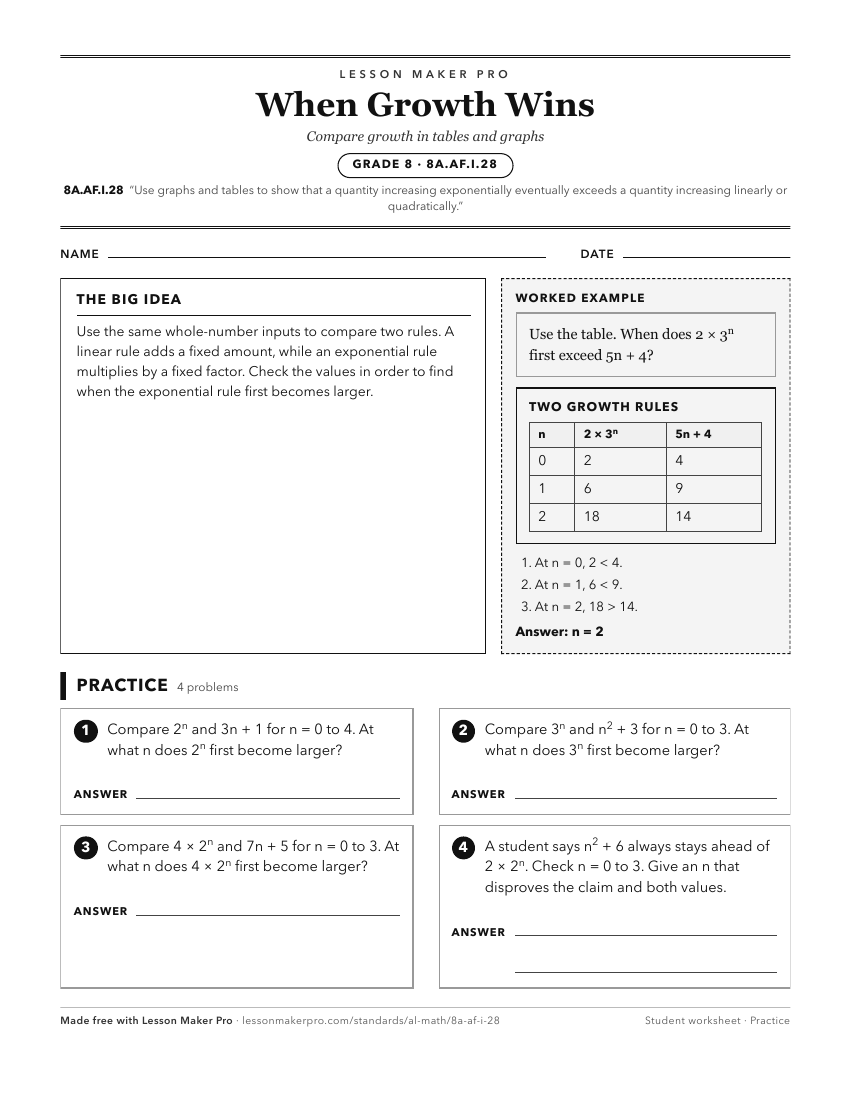
A ready-to-print activity worksheet aligned to 8A.AF.I.28, with an answer key for the teacher on its own page. No account needed.
PDF, US Letter, prints cleanly in black and white.
Download the worksheetKeep exploring
Related Standards
- A1P.AF.H.26
Use graphs and tables to show that a quantity increasing exponentially eventually exceeds a quantity increasing linearly or quadratically.
- 8.AF.E.17
Analyze the relationship (increasing or decreasing, linear or non-linear) between two quantities represented in a graph.
- 8A.AF.A.8
Analyze the relationship (increasing or decreasing, linear or non-linear) between two quantities represented in a graph.
- A1P.AF.H.28
For a function that models a relationship between two quantities, interpret key features of graphs and tables in terms of the quantities, and sketch graphs show...
Turn this exact standard into a lesson
Grade, subject, topic, and the complete standard are prefilled. Create one free, no account needed.
Also for this standard:Make a WorksheetMake a QuizMake a Sub Lesson