Alabama Math 8A.AF.F.16.b
The Standard
- 8A.AF.F
- Functions shift the emphasis from a point-by-point relationship between two variables (input/output) to considering an entire set of ordered pairs (where each first element is paired with exactly one second element) as an entity with its own features and characteristics.
- 8A.AF.F.16
- Define a function as a mapping from one set (called the domain) to another set (called the range) that assigns to each element of the domain exactly one element of the range.
Relate the domain of a function to its graph and, where applicable, to the quantitative relationship it describes. Limit to linear, quadratic, exponential, and absolute value functions.
2019 Alabama Course of Study: Mathematics · Functions shift the emphasis from a point-by-point relationship between two variables (input/output) to considering an entire set of ordered pairs (where each first element is paired with exactly one second element) as an entity with its own features and characteristics.
Teacher's field guide
What This Standard Means
What Students Need to Do
- Students find the x-values shown on a graph, including any endpoints or gaps. They connect those inputs to what makes sense in the situation. They do this for linear, quadratic, exponential, and absolute value functions.
What Mastery Looks Like
- Given a ball-height graph drawn from launch to landing, a student gives the time interval as its domain and includes both endpoints. They explain why the same quadratic rule, without the ball story, accepts all real x-values.
Common Misconceptions
- Students may list the y-values instead of the x-values. They may assume a curve continues past where the graph stops. Some include an open endpoint or think negative x-values are never allowed.
How to Assess It
- Exit ticket: Sketch h(t) = -t² + 4t for a ball from launch to landing. State the domain and explain why the graph stops at 0 and 4 seconds.
Lesson moves
Ways to Teach It
Tape a number line below a printed ball-flight graph; students shade the valid times from launch to landing.
Ask, "Why can x be negative in y = x², but time cannot be negative on a ball-flight graph?" Partners write two sentences.
Deal graph cards with full curves, truncated curves, and open endpoints; students match each to a domain card and defend one choice.
Graph a taxi fare of $3 plus $2 per mile; students mark valid distances and explain why negative miles do not fit.
Free download
Printable 8A.AF.F.16.b Worksheet
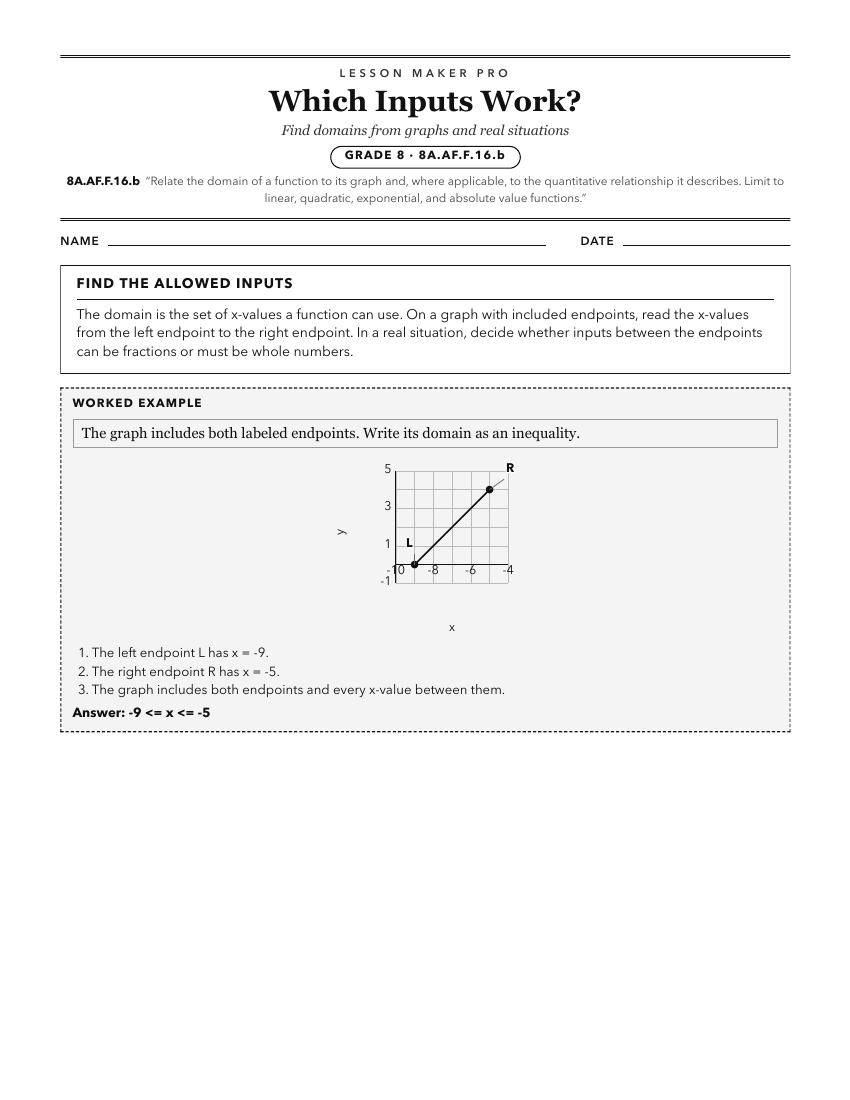
A ready-to-print activity worksheet aligned to 8A.AF.F.16.b, with an answer key for the teacher on its own page. No account needed.
PDF, US Letter, prints cleanly in black and white.
Download the worksheetKeep exploring
Related Standards
- A1P.AF.E.15.b
Relate the domain of a function to its graph and, where applicable, to the quantitative relationship it describes. Limit to linear, quadratic, exponential, and ...
- A2S.AF.H.18
Relate the domain of a function to its graph and, where applicable, to the quantitative relationship it describes. Extend to polynomial, trigonometric (sine and...
- 8A.AF.J.30
For a function that models a relationship between two quantities, interpret key features of graphs and tables in terms of the quantities, and sketch graphs show...
- A1P.AF.H.28
For a function that models a relationship between two quantities, interpret key features of graphs and tables in terms of the quantities, and sketch graphs show...
Turn this exact standard into a lesson
Grade, subject, topic, and the complete standard are prefilled. Create one free, no account needed.
Also for this standard:Make a WorksheetMake a QuizMake a Sub Lesson