Alabama Math 8.AF.B
Standard Cluster
Analyze the relationship between proportional and non-proportional situations.
2019 Alabama Course of Study: Mathematics
Cluster contents
Standards in This Cluster
8.AF.B is a cluster heading. These are the individual standards under it.
- 8.AF.B.7
Determine whether a relationship between two variables is proportional or non-proportional.
- 8.AF.B.8
Graph proportional relationships.
- 8.AF.B.8.a
Interpret the unit rate of a proportional relationship, describing the constant of proportionality as the slope of the graph which goes through the origin and h...
- 8.AF.B.9
Interpret y = mx + b as defining a linear equation whose graph is a line with m as the slope and b as the y-intercept.
- 8.AF.B.9.a
Use similar triangles to explain why the slope m is the same between any two distinct points on a non-vertical line in a coordinate plane.
- 8.AF.B.9.b
Given two distinct points in a coordinate plane, find the slope of the line containing the two points and explain why it will be the same for any two distinct p...
- 8.AF.B.9.c
Graph linear relationships, interpreting the slope as the rate of change of the graph and the y-intercept as the initial value.
- 8.AF.B.9.d
Given that the slopes for two different sets of points are equal, demonstrate that the linear equations that include those two sets of points may have different...
- 8.AF.B.10
Compare proportional and non-proportional linear relationships represented in different ways (algebraically, graphically, numerically in tables, or by verbal de...
Teacher's field guide
What This Cluster Means
What Students Need to Do
- Students compare tables, graphs, equations, and stories to see whether one quantity is always the same multiple of another. They check ratios and starting values, then explain how a fixed fee changes the relationship.
What Mastery Looks Like
- A student can identify y = 3x as proportional and y = 3x + 5 as non-proportional, even though both grow by 3 each step. They can use ratios or a graph to explain why.
Common Misconceptions
- Students may call any straight line proportional, even when it crosses the y-axis above zero. They may confuse a constant increase with a constant ratio.
How to Assess It
- On an exit ticket, give tables A: (0, 0), (1, 3), (2, 6) and B: (0, 4), (1, 7), (2, 10). Ask which is proportional and why.
Lesson moves
Ways to Teach It
Plot (0, 0), (1, 3), (2, 6) and (0, 4), (1, 7), (2, 10) on graph paper; compare where the lines start.
Ask, “Both lines rise 3 units for each step right. Why is only the line through (0, 0) proportional?”
Sort four cards: y = 4x, y = 4x + 5, a line through (0, 0), and a line through (0, 5); explain each choice.
Compare bike rentals charging $5 plus $2 per hour or just $2 per hour; graph costs for 0 to 4 hours.
Free download
Printable 8.AF.B Worksheet
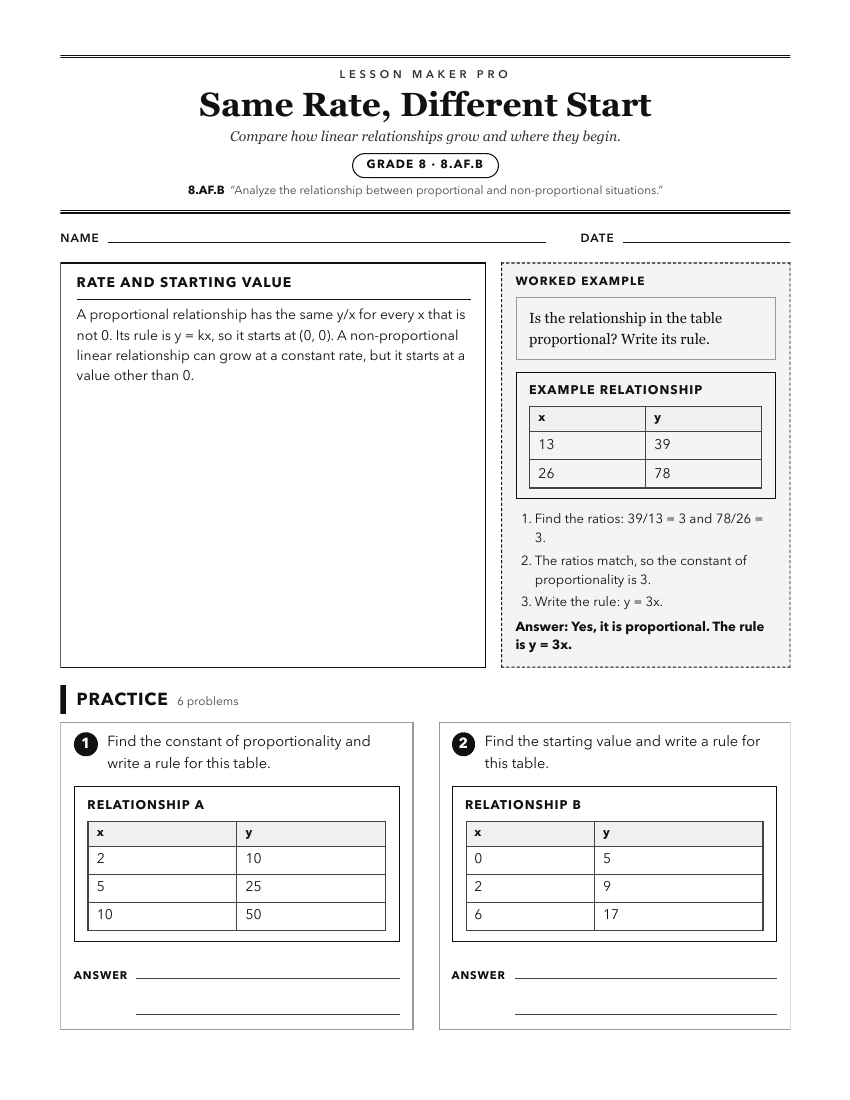
A ready-to-print activity worksheet aligned to 8.AF.B, with an answer key for the teacher on its own page. No account needed.
PDF, US Letter, prints cleanly in black and white.
Download the worksheetKeep exploring
Related Standards
Turn this cluster into a lesson
Grade, subject, topic, and the complete cluster are prefilled. Create one free, no account needed.
Also for this cluster:Make a WorksheetMake a QuizMake a Sub Lesson