Alabama Math 8.AF.B.10
The Standard
- 8.AF.B
- Analyze the relationship between proportional and non-proportional situations.
Compare proportional and non-proportional linear relationships represented in different ways (algebraically, graphically, numerically in tables, or by verbal descriptions) to solve real-world problems.
2019 Alabama Course of Study: Mathematics · Algebra and Functions
Teacher's field guide
What This Standard Means
What Students Need to Do
- Students find the rate and starting amount in a table, graph, equation, or story. They tell whether a relationship is proportional by checking whether it starts at zero. They compare two plans at a given amount and find when the costs match.
What Mastery Looks Like
- Given $4 per hour and $5 plus $3 per hour, a student writes y = 4x and y = 3x + 5. They show that both cost $20 at five hours and that the second plan costs less at eight hours.
Common Misconceptions
- Students may call any straight-line graph proportional, even when it does not pass through zero. They may compare only the hourly rates and ignore a starting fee. Some mix up the input and output columns in a table.
How to Assess It
- Exit ticket: Bike Plan A costs $4 per hour and Plan B costs $5 plus $3 per hour; identify the proportional plan and the cheaper plan for eight hours, using a table or equations.
Lesson moves
Ways to Teach It
Give pairs graph paper and colored pencils to plot $4 per hour and $5 plus $3 per hour from zero to eight hours.
Ask students to explain why $5 plus $3 per hour costs more than $4 per hour for one hour but less for eight.
Hand groups cards for y = 4x and y = 3x + 5, with matching tables and graphs; race to group each set.
Post two delivery offers, $3 per item or $4 plus $2 per item; students choose the cheaper option for six items.
Free download
Printable 8.AF.B.10 Worksheet
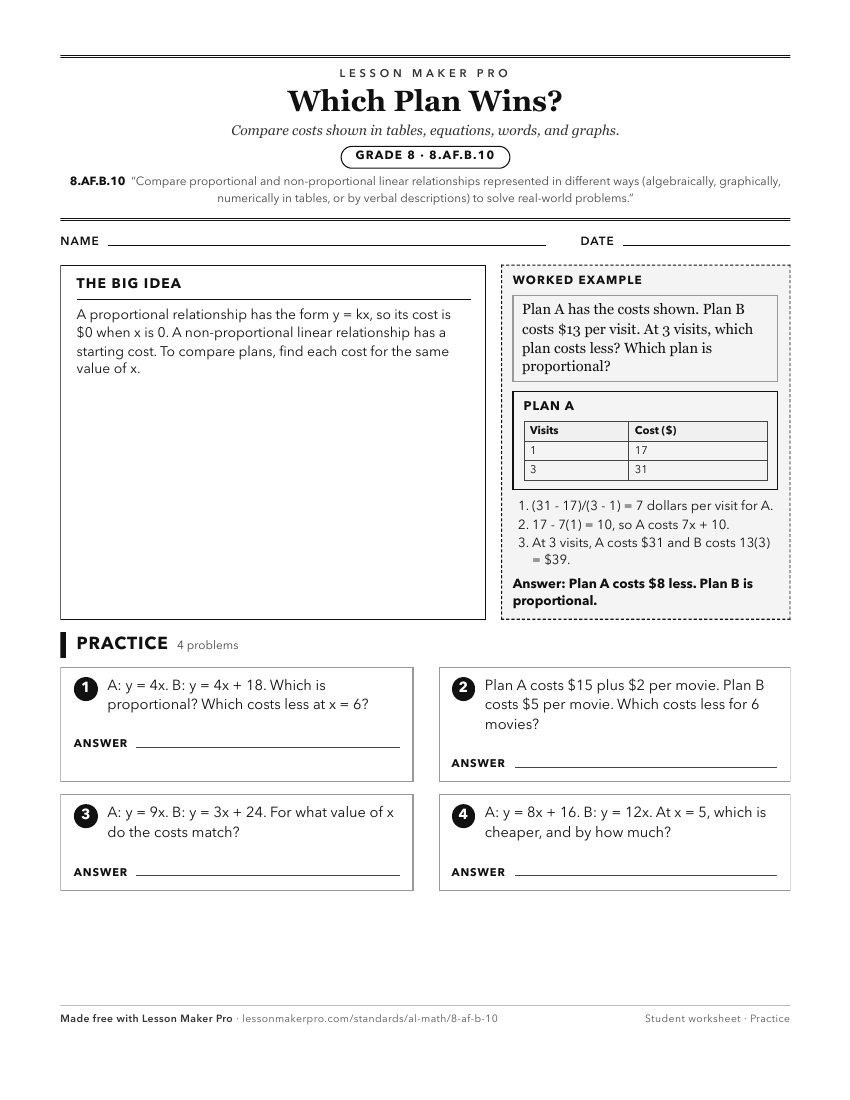
A ready-to-print activity worksheet aligned to 8.AF.B.10, with an answer key for the teacher on its own page. No account needed.
PDF, US Letter, prints cleanly in black and white.
Download the worksheetKeep exploring
Related Standards
- 7A.PR.B.7
Compare proportional and non-proportional linear relationships represented in different ways (algebraically, graphically, numerically in tables, or by verbal de...
- 7A.PR.A.2.b
Identify the constant of proportionality (unit rate) and express the proportional relationship using multiple representations including tables, graphs, equation...
- 7.RP.A.2.b
Identify the constant of proportionality (unit rate) and express the proportional relationship using multiple representations including tables, graphs, equation...
Turn this exact standard into a lesson
Grade, subject, topic, and the complete standard are prefilled. Create one free, no account needed.
Also for this standard:Make a WorksheetMake a QuizMake a Sub Lesson