Alabama Math 7A.PR.B.5
Standard Cluster
- 7A.PR.B
- Analyze the relationship between proportional and non-proportional situations.
Graph proportional relationships. a. Interpret the unit rate of a proportional relationship, describing the constant of proportionality as the slope of the graph which goes through the origin and has the equation y = mx where m is the slope.
2019 Alabama Course of Study: Mathematics
Cluster contents
Standards in This Cluster
7A.PR.B.5 is a cluster heading. These are the individual standards under it.
Teacher's field guide
What This Cluster Means
What Students Need to Do
- Students plot pairs from a proportional relationship and draw a line through the origin. They find how much y increases when x increases by 1, then use that rate to write y = mx.
What Mastery Looks Like
- Given points (0, 0) and (4, 10), a student finds a slope of 2.5 and writes y = 2.5x. They can explain what 2.5 means in the situation and check that another point fits the equation.
Common Misconceptions
- Students may divide x by y instead of y by x when finding the rate. Some treat any straight line as proportional, even when it does not pass through (0, 0). Others read the slope as the total y-value rather than the amount per 1 unit of x.
How to Assess It
- Exit ticket: A walker covers 5 miles in 2 hours at a steady pace. Graph time in hours against distance in miles, write the equation, and explain the slope.
Lesson moves
Ways to Teach It
Give pairs graph paper and counters to plot 2 apples per bag for 0 through 4 bags, then draw the line.
Show two lines, one through (0, 0) and one through (0, 2), and ask which can represent a proportional relationship and why.
Have students match cards showing tables, graphs, equations, and unit rates, then check each match by finding y divided by x.
Use a grocery price of $1.50 per pound; students graph costs for 0 through 4 pounds and label the slope.
Free download
Printable 7A.PR.B.5 Worksheet
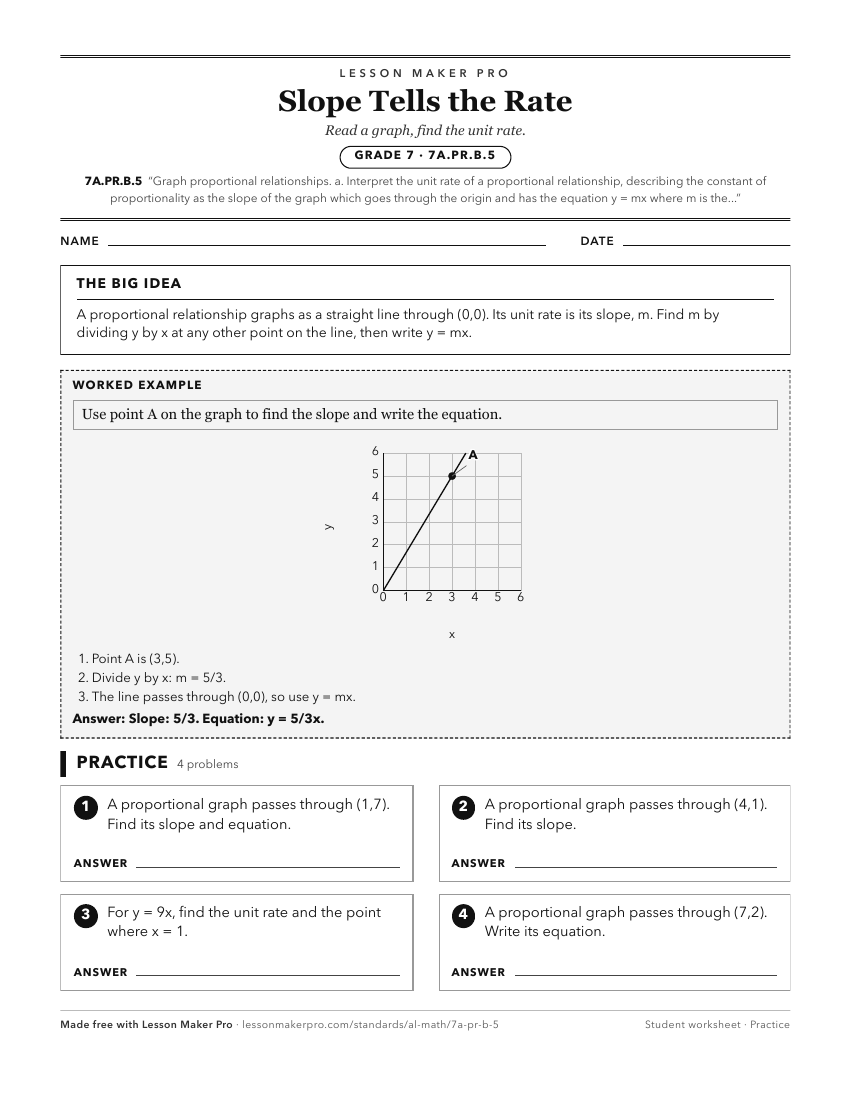
A ready-to-print activity worksheet aligned to 7A.PR.B.5, with an answer key for the teacher on its own page. No account needed.
PDF, US Letter, prints cleanly in black and white.
Download the worksheetKeep exploring
Related Standards
- 8.AF.B.8
Graph proportional relationships.
- 8.AF.B.10
Compare proportional and non-proportional linear relationships represented in different ways (algebraically, graphically, numerically in tables, or by verbal de...
- 7A.PR.B.7
Compare proportional and non-proportional linear relationships represented in different ways (algebraically, graphically, numerically in tables, or by verbal de...
- 7.RP.A.2.a
Use equivalent ratios displayed in a table or in a graph of the relationship in the coordinate plane to determine whether a relationship between two quantities ...
Turn this cluster into a lesson
Grade, subject, topic, and the complete cluster are prefilled. Create one free, no account needed.
Also for this cluster:Make a WorksheetMake a QuizMake a Sub Lesson