Alabama Math 7A.AF.D
Standard Cluster
Explain, evaluate, and compare functions.
2019 Alabama Course of Study: Mathematics · Grade 7 Accelerated Standards
Cluster contents
Standards in This Cluster
7A.AF.D is a cluster heading. These are the individual standards under it.
- 7A.AF.D.22
Identify the effect on the graph of replacing f(x) by f(x) + k, k · f(x), f(kx), and f(x + k) for specific values of k (both positive and negative); find the va...
- 7A.AF.D.23
Construct a function to model the linear relationship between two variables.
- 7A.AF.D.23.a
Interpret the rate of change (slope) and initial value of the linear function from a description of a relationship from two points in a table or graph.
- 7A.AF.D.24
Explain why the x-coordinates of the points where the graphs of the equations y = f(x) and y = g(x) intersect are the solutions of the equation f(x) = g(x). Lim...
- 7A.AF.D.25
Find approximate solutions by graphing the functions, making tables of values, or finding successive approximations, using technology where appropriate.
Teacher's field guide
What This Cluster Means
What Students Need to Do
- Students find a function's output from a rule, table, or graph. They explain what the inputs and outputs mean, then compare two functions using the same inputs.
What Mastery Looks Like
- A student can find the output when the input is 4, whether the function is shown as a rule, table, or graph. They can explain which of two functions gives a greater output at 4 and how each output changes as the input increases.
Common Misconceptions
- Students may switch the input and output columns or read a graph's horizontal value as the output. They may compare two outputs that come from different inputs or assume the function with the larger starting value always has the larger output.
How to Assess It
- Give students the rule y = 2x + 3 and a table showing inputs 0, 1, and 2 with outputs 5, 7, and 9. Ask: What does each function output when the input is 2, and which output is greater?
Lesson moves
Ways to Teach It
Give pairs counters and a rule card, 'double then add 3'; have them build outputs for inputs 0, 1, and 2.
Ask students to write which costs less for five rides: $4 plus $2 per ride or $3 per ride, and explain.
Play function match: students pair rule cards, input-output tables, and graphs, then test input 2 to check each match.
Use two taxi fare cards, '$4 plus $2 per mile' and '$3 per mile'; compare costs for 2 and 6 miles.
Free download
Printable 7A.AF.D Worksheet
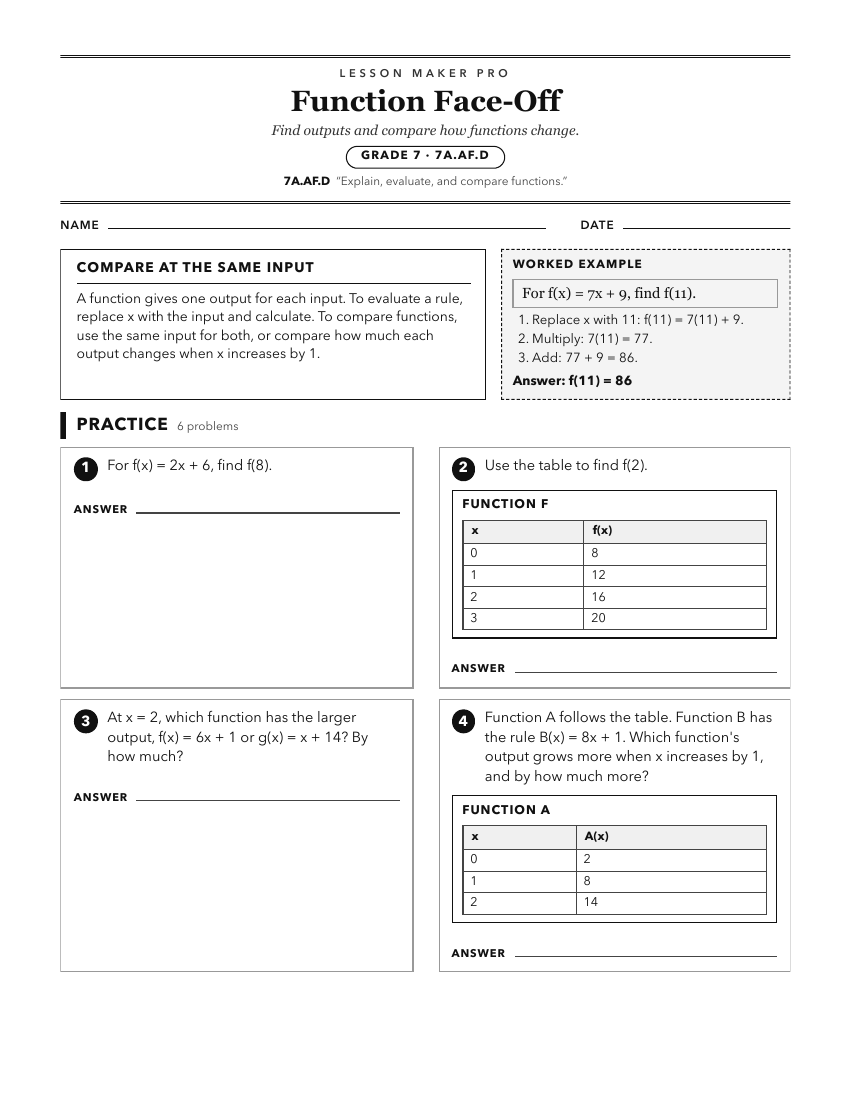
A ready-to-print activity worksheet aligned to 7A.AF.D, with an answer key for the teacher on its own page. No account needed.
PDF, US Letter, prints cleanly in black and white.
Download the worksheetKeep exploring
Related Standards
- 8.AF.D
Explain, evaluate, and compare functions.
- 8A.AF.H.23
Compare properties of two functions, each represented in a different way (algebraically, graphically, numerically in tables, or by verbal descriptions). Include...
- A1P.AF.G.21
Compare properties of two functions, each represented in a different way (algebraically, graphically, numerically in tables, or by verbal descriptions). Extend ...
- A2S.AF.F.15
Compare properties of two functions each represented in a different way (algebraically, graphically, numerically in tables, or by verbal descriptions). Extend t...
Turn this cluster into a lesson
Grade, subject, topic, and the complete cluster are prefilled. Create one free, no account needed.
Also for this cluster:Make a WorksheetMake a QuizMake a Sub Lesson