Alabama Math 8A.AF.H.23
Standard Cluster
- 8A.AF.H
- Functions can be described by using a variety of representations: mapping diagrams, function notation (e.g., f(x) = x²), recursive definitions, tables, and graphs.
Compare properties of two functions, each represented in a different way (algebraically, graphically, numerically in tables, or by verbal descriptions). Include linear, quadratic, exponential, absolute value, and linear piecewise. a. Distinguish between linear and non-linear functions.
2019 Alabama Course of Study: Mathematics
Cluster contents
Standards in This Cluster
8A.AF.H.23 is a cluster heading. These are the individual standards under it.
Teacher's field guide
What This Cluster Means
What Students Need to Do
- Students compare two functions shown as equations, graphs, tables, or word descriptions. They check shared input values and how outputs change as inputs grow. They decide whether each function has one constant rate, even when its graph has straight pieces.
What Mastery Looks Like
- A student can use equal input steps to show that a table is linear or that a quadratic table is not. They can spot repeated multiplication in an exponential table and explain why a V-shaped graph is not linear. They can compare values and rates across two different representations.
Common Misconceptions
- Students may call any graph with straight segments linear, even when the rate changes between segments. They may confuse a constant multiplier with a constant increase. They may check only one arm of a V-shaped graph and miss the change in direction.
How to Assess It
- Exit ticket: Compare f(x) = 2x + 3 with g's table: (0, 3), (1, 5), (2, 9), (3, 15). Which is linear? Show how the outputs change in each function.
Lesson moves
Ways to Teach It
Give pairs grid paper, a table card, and an equation card; have them plot both functions and mark where their rates change.
Ask, 'A V-shaped graph has straight arms. Is it linear?' Have students defend their answer using changes across the whole graph.
Play card sort: match linear, quadratic, exponential, absolute value, and piecewise functions across equations, tables, graphs, and descriptions.
Graph Lot A's $3 entry plus $2 per hour and Lot B's $2 hourly rate that doubles after two hours; compare their rates.
Free download
Printable 8A.AF.H.23 Worksheet
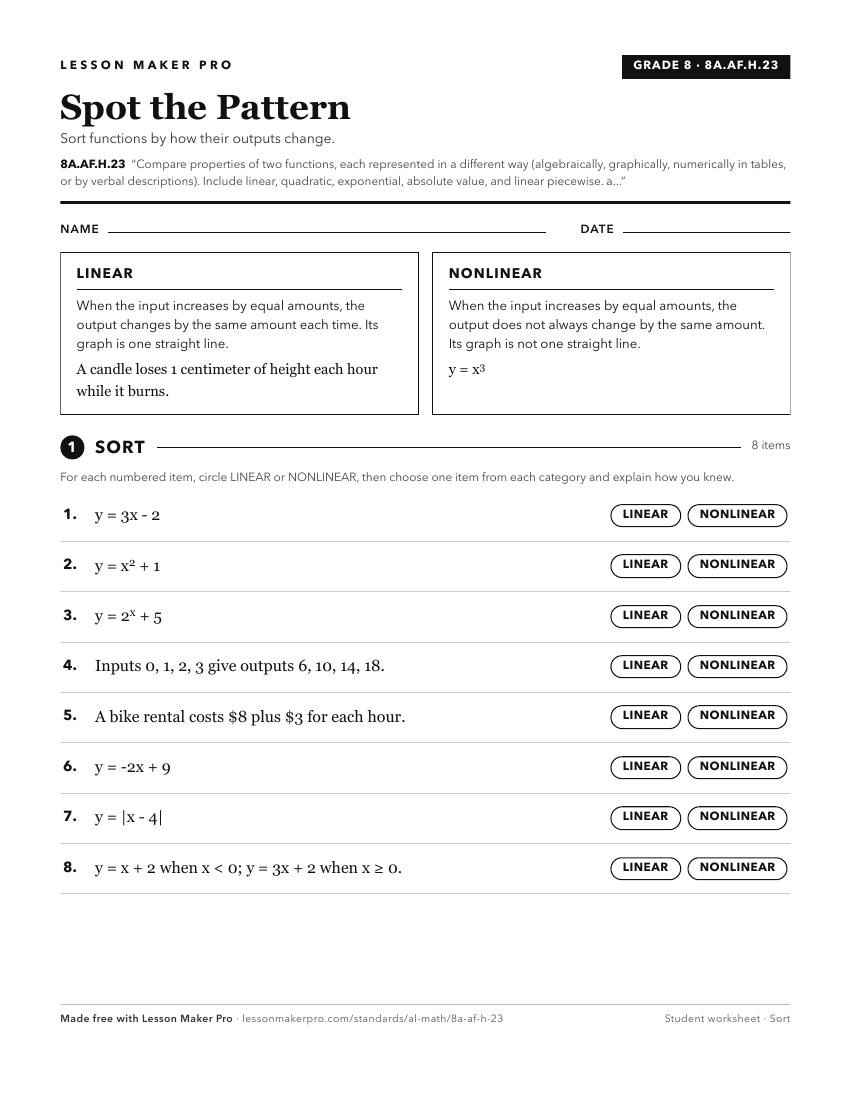
A ready-to-print activity worksheet aligned to 8A.AF.H.23, with an answer key for the teacher on its own page. No account needed.
PDF, US Letter, prints cleanly in black and white.
Download the worksheetKeep exploring
Related Standards
- A1P.AF.G.21
Compare properties of two functions, each represented in a different way (algebraically, graphically, numerically in tables, or by verbal descriptions). Extend ...
- A2S.AF.F.15
Compare properties of two functions each represented in a different way (algebraically, graphically, numerically in tables, or by verbal descriptions). Extend t...
- 8.AF.D.15
Compare properties of functions represented algebraically, graphically, numerically in tables, or by verbal descriptions.
- PC.F.A.24
Compare and contrast families of functions and their representations algebraically, graphically, numerically, and verbally in terms of their key features. Famil...
Turn this cluster into a lesson
Grade, subject, topic, and the complete cluster are prefilled. Create one free, no account needed.
Also for this cluster:Make a WorksheetMake a QuizMake a Sub Lesson