Virginia SOL 8.PFA.3.d
The Standard
Create a table of values for a linear function given a graph, equation in the form of y = mx + b, or context.
Virginia Standards of Learning for Mathematics · The student will represent and solve problems, including those in context, by using linear functions and analyzing their key characteristics (the value of the y-intercept (b) and the coordinates of the ordered pairs in graphs will be limited to integers).
Teacher's field guide
What This Standard Means
What Students Need to Do
- Students organize matching input and output values in a table. They read points from a line, substitute x-values into an equation, or calculate values from a situation.
What Mastery Looks Like
- Students label input and output columns and record accurate ordered pairs. They can check that each pair fits the equation, appears on the graph, or makes sense in the situation.
Common Misconceptions
- Students may reverse the x- and y-columns or misread the graph's scale. They may multiply incorrectly, forget to add b, or treat b as an x-value. In contexts, they may confuse the starting amount with the rate of change.
How to Assess It
- Give students y = -2x + 3 and x-values -1, 0, and 2. Ask them to complete a labeled table and circle the y-intercept pair.
Lesson moves
Ways to Teach It
Make a floor coordinate grid, have students stand on a drawn line, and record their coordinates in a table.
Show an incomplete table and ask, "Which value belongs next, and how do you know?"
Play a card match using sets of graphs, equations, contexts, and completed value tables.
Use a taxi fare with a fixed pickup fee and per-mile charge, then build a table for several trip lengths.
Free download
Printable 8.PFA.3.d Worksheet
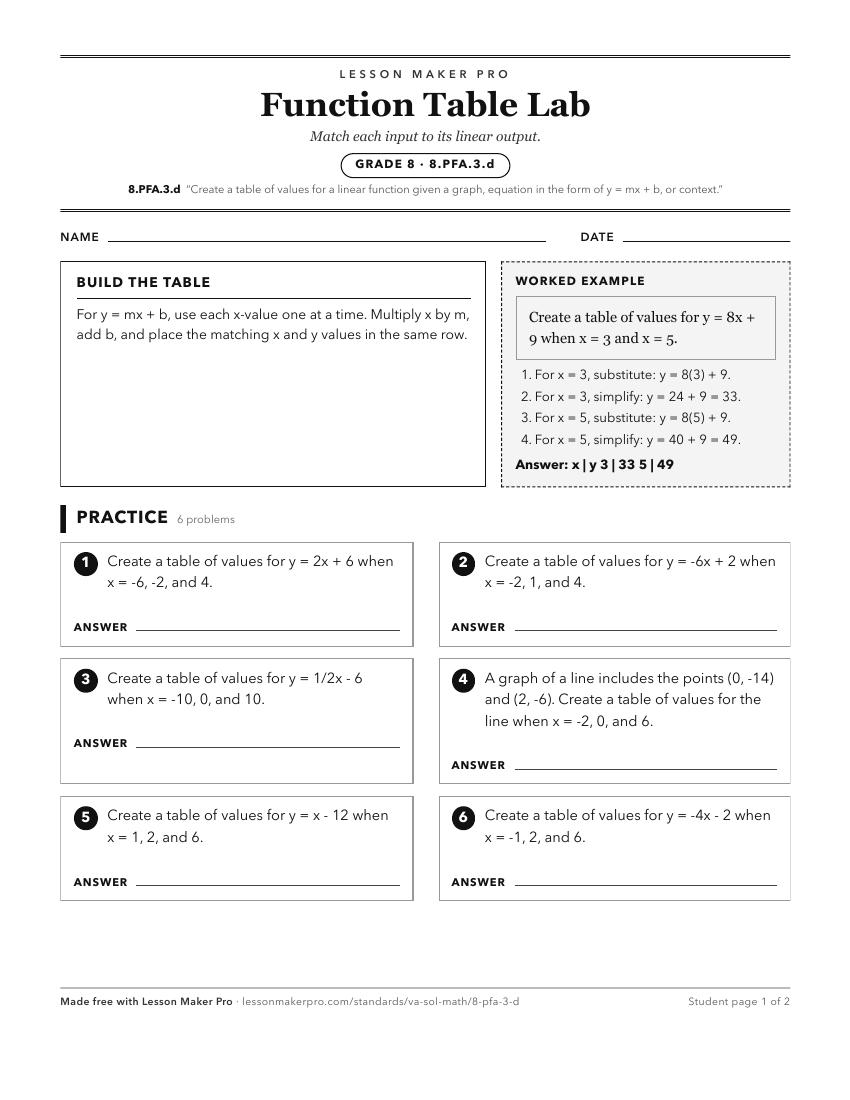
A ready-to-print activity worksheet aligned to 8.PFA.3.d, with an answer key for the teacher on its own page. No account needed.
PDF, US Letter, prints cleanly in black and white.
Download the worksheetKeep exploring
Related Standards
- 7.PFA.1.d
Graph a line representing a proportional relationship between two quantities given the equation of the line in the form y = mx, where m represents the slope as ...
- 8.PFA.3.c
Graph a linear function given a table, equation, or a situation in context.
- 8.PFA.3.f
Create a context for a linear function given a graph, table, or equation in the form y = mx + b.
- 8.PFA.3.e
Write an equation of a linear function in the form y = mx + b, given a graph, table, or a situation in context.
Turn this exact standard into a lesson
Grade, subject, topic, and the complete standard are prefilled. Create one free, no account needed.
Also for this standard:Make a WorksheetMake a QuizMake a Sub Lesson