Virginia SOL 5.PS.2.a
The Standard
Describe mean as fair share.
Virginia Standards of Learning for Mathematics · The student will solve contextual problems using measures of center and the range.
Teacher's field guide
What This Standard Means
What Students Need to Do
- Students combine all the data values and redistribute the total into equal groups. They connect the amount in each equal group to the average for the data set.
What Mastery Looks Like
- A student can combine the values, divide the total equally, and identify the amount in each group. The student can explain what that amount means in the given situation.
Common Misconceptions
- Students may divide by the wrong number, such as the largest value instead of the number of data values. They may confuse mean with median or think the mean must appear in the data set.
How to Assess It
- Exit ticket: Four students collected 3, 5, 6, and 10 cans. Show the fair share with a picture or equation, then explain what 6 represents.
Lesson moves
Ways to Teach It
Place 2, 5, 7, and 10 counters into four cups, then redistribute them equally and record the amount in each cup.
Ask students to explain why the mean of 4, 6, and 11 can be a number not listed in the data set.
Pairs draw four number cards, build matching counter piles, redistribute the counters equally, and score a point for naming the mean.
Share 28 classroom pencils equally among four tables, then discuss how the fair share represents the mean number of pencils per table.
Free download
Printable 5.PS.2.a Worksheet
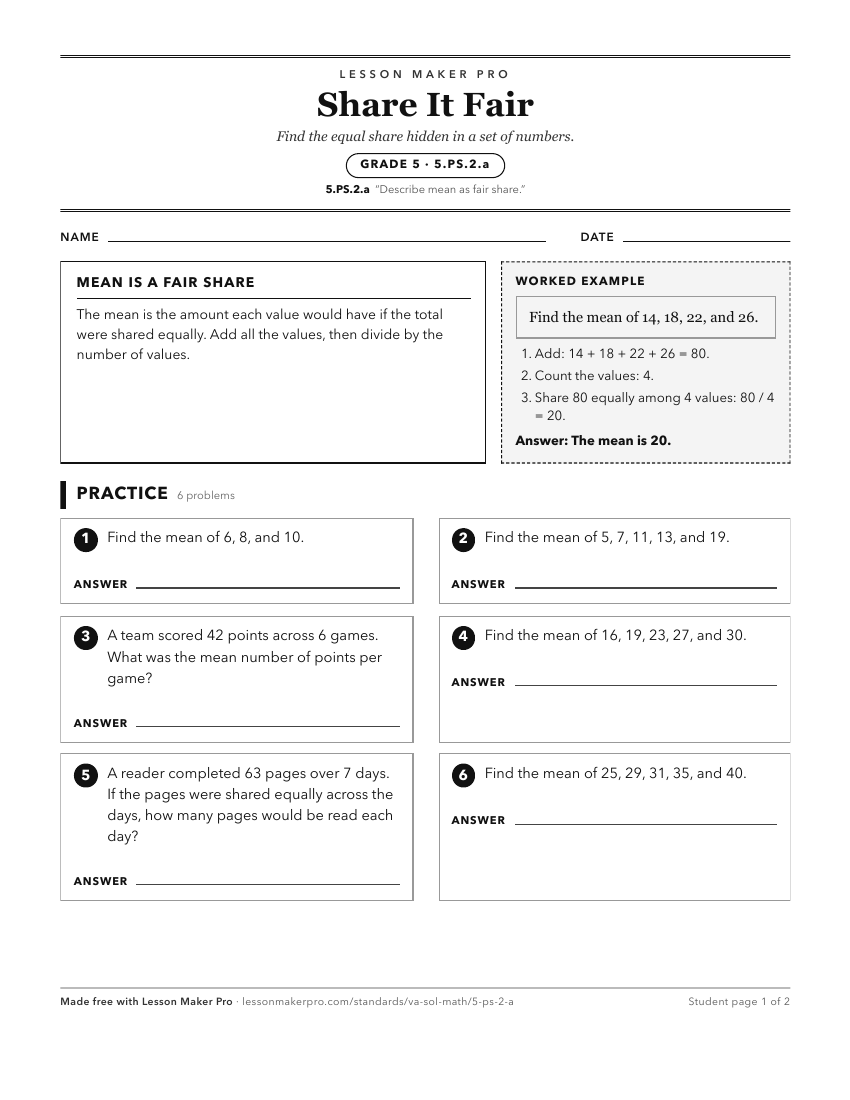
A ready-to-print activity worksheet aligned to 5.PS.2.a, with an answer key for the teacher on its own page. No account needed.
PDF, US Letter, prints cleanly in black and white.
Download the worksheetKeep exploring
Related Standards
- 5.PS.2.b
Describe and determine the mean of a set of data values representing data from a given context as a measure of center.
- 1.NS.3.c
Describe and justify how shares are equal pieces or equal parts of the whole (limited to halves, fourths) when given a contextual problem.
- 1.NS.3.a
Represent equal shares of a whole with two or four sharers, when given a contextual problem.
- 6.PS.2.a
Represent the mean of a set of data graphically as the balance point represented in a line plot (dot plot).
Turn this exact standard into a lesson
Grade, subject, topic, and the complete standard are prefilled. Create one free, no account needed.
Also for this standard:Make a WorksheetMake a QuizMake a Sub Lesson