Virginia SOL 9.RI.1.B
The Standard
Explain the purpose and interpret the use of data and information in maps, charts, graphs, timelines, tables, and diagrams in informational, historical, scientific, or technical texts.
Virginia Standards of Learning for English · Key Ideas and Confirming Details
Teacher's field guide
What This Standard Means
What Students Need to Do
- Students explain why an author included a map, chart, graph, timeline, table, or diagram. They interpret its data and connect that information to claims or ideas in the text.
What Mastery Looks Like
- Students accurately read titles, labels, scales, keys, and data points. They explain the visual’s purpose, state a supported conclusion, and connect it to the surrounding text.
Common Misconceptions
- Students may treat visuals as decoration or repeat numbers without explaining their meaning. They may overlook titles, labels, units, scales, or keys and make claims the data does not support.
How to Assess It
- Give students a short paragraph with a graph. Ask: “Why did the author include this graph, and what claim does it support? Cite two data points.”
Lesson moves
Ways to Teach It
Give pairs a short article and three loose visuals; students match each visual to a paragraph and annotate the supporting evidence.
Project a timeline and ask, “What does its order reveal that the paragraph alone does not?” Students write two evidence-based sentences.
Run a graph detective game where teams earn points for finding the title, scale, trend, outlier, and strongest supported claim.
Use a local weather chart and forecast; students explain which data supports the forecast and where the chart limits certainty.
Free download
Printable 9.RI.1.B Worksheet
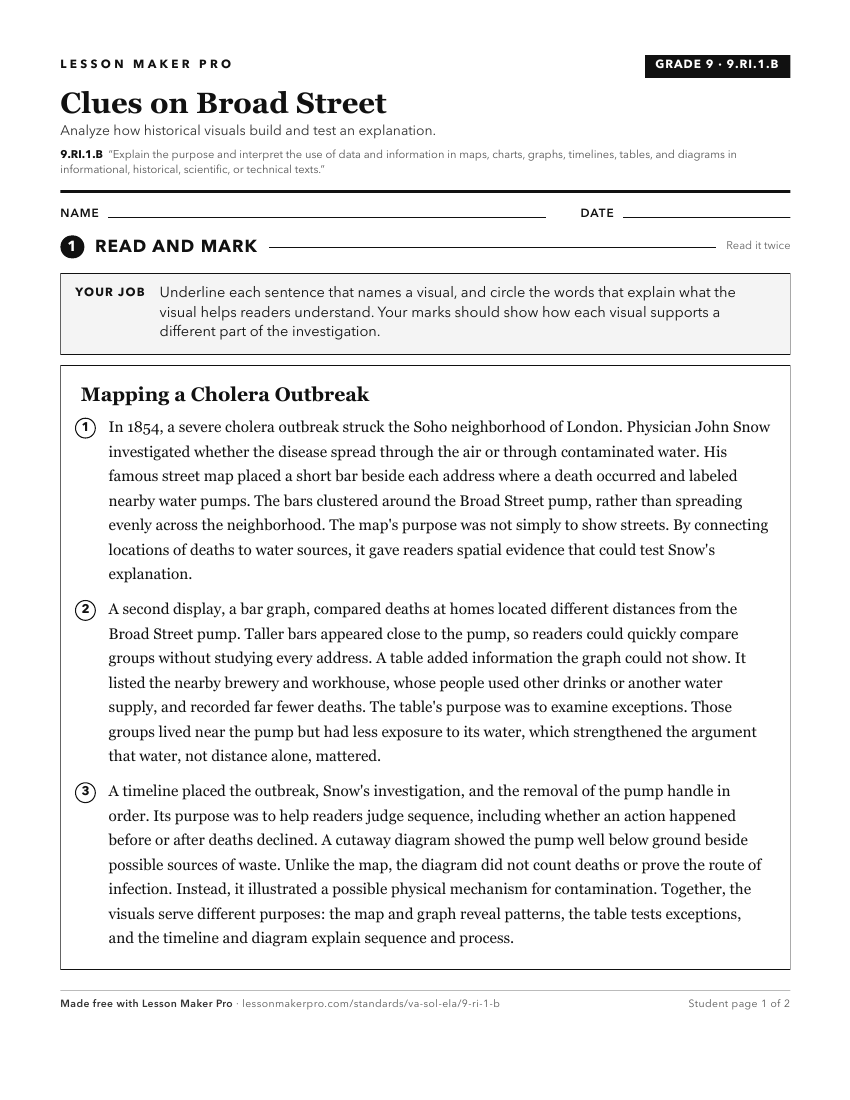
A ready-to-print activity worksheet aligned to 9.RI.1.B, with an answer key for the teacher on its own page. No account needed.
PDF, US Letter, prints cleanly in black and white.
Download the worksheetKeep exploring
Related Standards
- 10.RI.1.B
Compare characteristics of the information from informational, historical, scientific, and technical texts and interpret the use of data and information in maps...
- 2.R.1.C
Use templates to organize the information collected (e.g., charts, graphs).
- 11.RI.1.B
Analyze the hypotheses, data, analysis, and/or conclusions in informational, historical, scientific, or technical texts, verifying the data when possible and co...
- 2.RI.2.A
Use text features (table of contents, headings, pictures, captions, maps, and charts) to preview, set a purpose for reading and gain information.
Turn this exact standard into a lesson
Grade, subject, topic, and the complete standard are prefilled. Create one free, no account needed.
Also for this standard:Make a WorksheetMake a QuizMake a Sub Lesson