Texas TEKS K.2.B
The Standard
- K.2
- Scientific and engineering practices. The student analyzes and interprets data to derive meaning, identify features and patterns, and discover relationships or correlations to develop evidence-based arguments or evaluate designs. The student is expected to:
analyze data by identifying significant features and patterns
Texas Essential Knowledge and Skills for Science
Teacher's field guide
What This Standard Means
What Students Need to Do
- Students look at simple data shown with objects, pictures, tally marks, or a class chart. They identify what appears most, least, the same, or in a repeating pattern.
What Mastery Looks Like
- Students point out a clear feature or pattern and support it with details from the data. They can say, for example, “Red appears most because there are six red blocks.”
Common Misconceptions
- Students may choose a result based on color, size, or personal preference instead of the data. They may also miscount pictures or call any arrangement a pattern without showing what repeats.
How to Assess It
- Show a picture graph with 3 cats, 5 dogs, and 2 fish. Ask, “What do you notice, and which numbers prove it?”
Lesson moves
Ways to Teach It
Give groups colored cubes to sort, count, and arrange in rows, then circle one feature they notice.
Show a class weather chart and ask, “What happened most often this week, and how do you know?”
Play Data Detective by showing object groups and having students earn a point for naming a feature supported by a count.
Count vehicle colors in the pickup line, make a picture graph, and identify the most and least common colors.
Free download
Printable K.2.B Worksheet
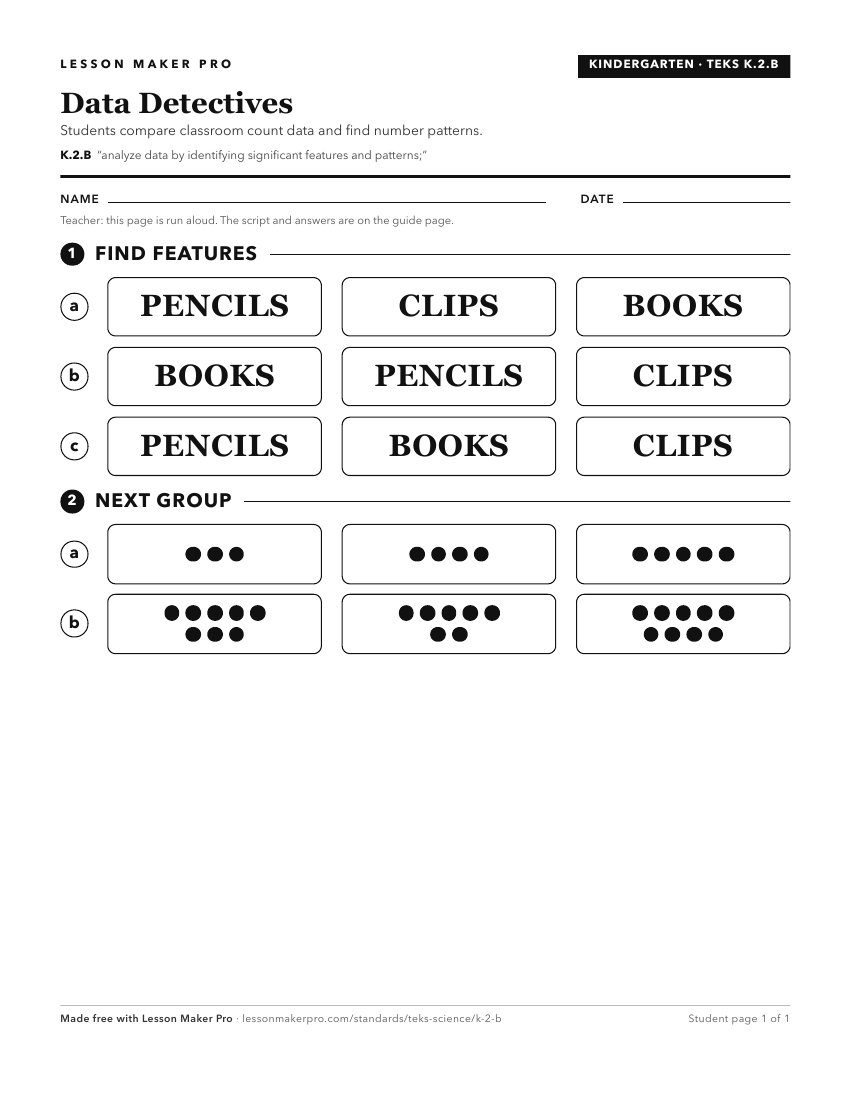
A ready-to-print activity worksheet aligned to K.2.B, with an answer key for the teacher on its own page. No account needed.
PDF, US Letter, prints cleanly in black and white.
Download the worksheetKeep exploring
Related Standards
Turn this exact standard into a lesson
Grade, subject, topic, and the complete standard are prefilled. Create one free, no account needed.
Also for this standard:Make a WorksheetMake a QuizMake a Sub Lesson