Oklahoma Science 5.ESS2.2
The Standard
Describe and graph amounts of saltwater and freshwater in various reservoirs to provide evidence about the distribution of water on Earth.
Oklahoma Academic Standards for Science (2026)
Teacher's field guide
What This Standard Means
What Students Need to Do
- Students sort water into saltwater and freshwater and identify where each is stored. They graph amounts in oceans, ice, groundwater, lakes, and rivers, then use the graph to compare them.
What Mastery Looks Like
- Given a water data table, a student makes a labeled graph with bars that match the numbers. They can explain that most of Earth’s water is salty and most freshwater is frozen or underground.
Common Misconceptions
- Students may think most freshwater is in lakes and rivers because those are easy to see. They may also treat 3% of all Earth’s water as if it means 3% of freshwater.
How to Assess It
- Give students a card showing 97 ocean units and 3 freshwater units. Ask them to draw a labeled two-bar graph and name two places freshwater is stored.
Lesson moves
Ways to Teach It
Sort 100 blue beads into ocean and freshwater cups, 97 and 3, then draw two labeled bars that match the cups.
Show a photo of a lake beside a water graph and ask, “Why is the lake’s bar tiny when the lake looks so large?”
Give pairs ocean, glacier, aquifer, lake, and river cards to sort by saltwater or freshwater, then rank by amount using a data card.
Read a local water utility source sheet, then find its river, lake, or well on a map and label the source.
Free download
Printable 5.ESS2.2 Worksheet
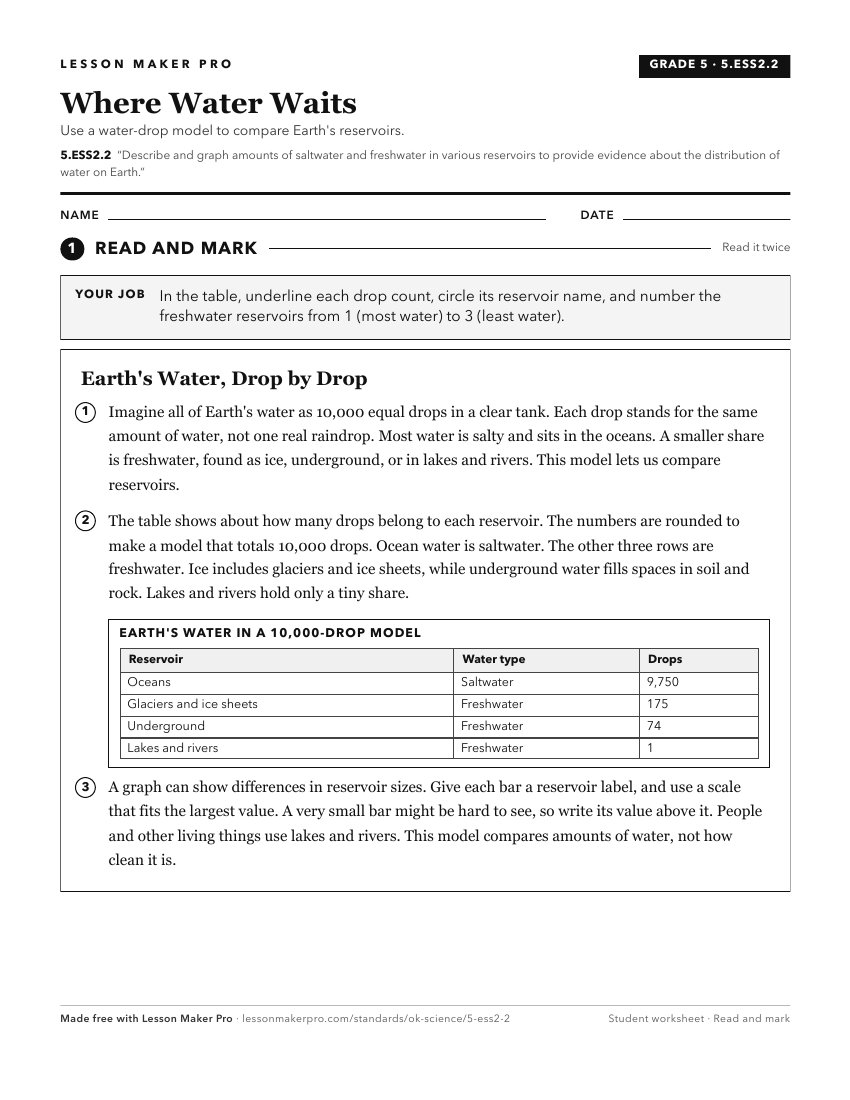
A ready-to-print activity worksheet aligned to 5.ESS2.2, with an answer key for the teacher on its own page. No account needed.
PDF, US Letter, prints cleanly in black and white.
Download the worksheetTurn this exact standard into a lesson
Grade, subject, topic, and the complete standard are prefilled. Create one free, no account needed.
Also for this standard:Make a WorksheetMake a QuizMake a Sub Lesson