Oklahoma Math PA.A.1.3
The Standard
- PA.A.1
- Explain the concept of function in mathematical situations and distinguish between the concepts of linear and nonlinear functions.
Identify a function as linear if it can be expressed in the form y = mx + b or if its graph is a non-vertical straight line.
Oklahoma Academic Standards for Mathematics (2022)
Teacher's field guide
What This Standard Means
What Students Need to Do
- Students decide whether an equation or graph shows a linear function. They look for an equation in the form y = mx + b or a nonvertical straight line.
What Mastery Looks Like
- A student can label y = -2x + 5 as linear, y = x² as nonlinear, and x = 3 as not a function. They can explain why y = 7 is linear even though x is missing.
Common Misconceptions
- Some students call every straight line a linear function, including a vertical line. Others reject y = 7 because x is missing, or mistake a curved graph for a straight line after plotting too few points.
How to Assess It
- Ask students to classify y = 3x - 2, y = x² + 1, and x = 4 as linear, nonlinear, or not a function. Have them give one reason for each choice.
Lesson moves
Ways to Teach It
On graph paper, plot y = 2x + 1 and y = x² for x = -2, -1, 0, 1, 2; compare the shapes.
Ask, “Is y = 5 a linear function? Is x = 5 a function?” Have students sketch and explain both answers.
Sort equation cards into linear, nonlinear, and not a function piles; include y = 4x, y = x², y = 6, and x = 6.
Plot a taxi fare of $4 plus $2 per mile for 0, 1, 2, and 3 miles; write its equation.
Free download
Printable PA.A.1.3 Worksheet
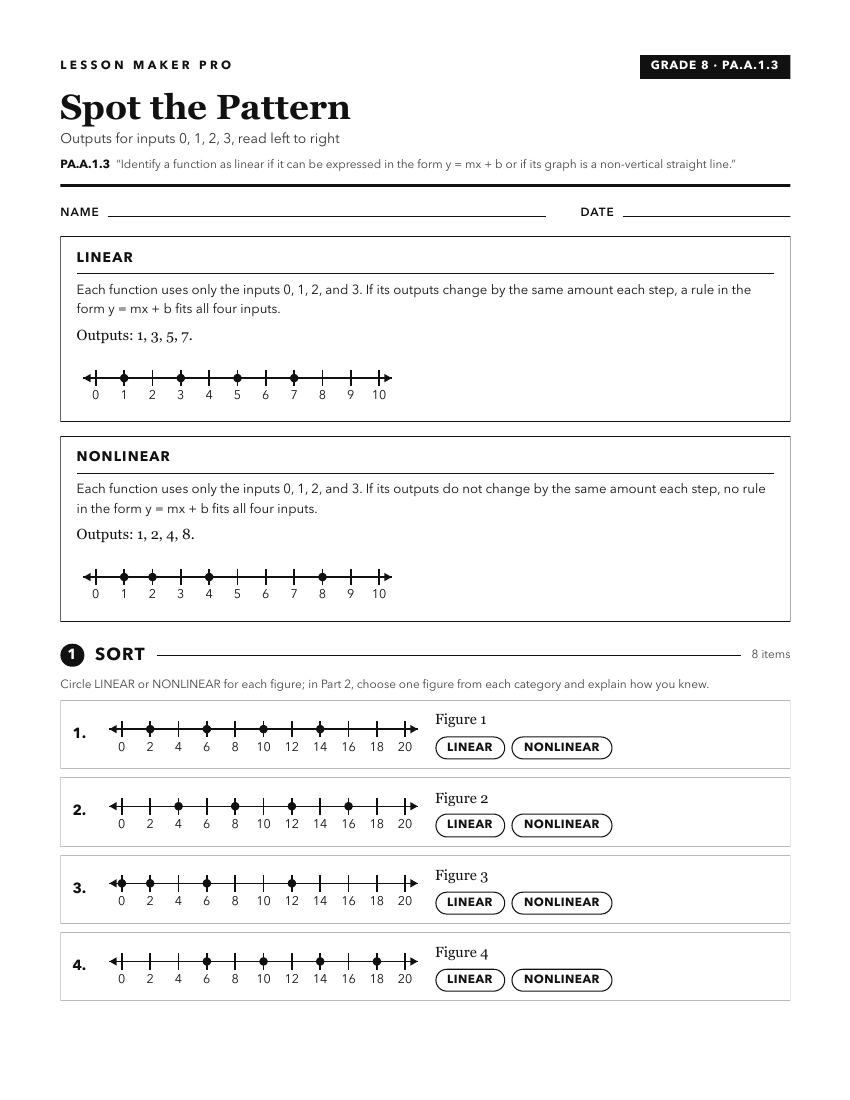
A ready-to-print activity worksheet aligned to PA.A.1.3, with an answer key for the teacher on its own page. No account needed.
PDF, US Letter, prints cleanly in black and white.
Download the worksheetKeep exploring
Related Standards
- PA.A.2.3
Identify graphical properties of linear functions, including slope and intercepts. Know that the slope equals the rate of change, and that the y-intercept is ze...
- PA.A.2
Identify and justify linear functions using mathematical models and situations; solve problems involving linear functions and interpret results in the original ...
- PA.A.1.2
Use linear functions to represent and model mathematical situations.
- PA.A.2.4
Predict the effect on the graph of a linear function when the slope or y-intercept changes. Use appropriate tools to examine these effects.
Turn this exact standard into a lesson
Grade, subject, topic, and the complete standard are prefilled. Create one free, no account needed.
Also for this standard:Make a WorksheetMake a QuizMake a Sub Lesson