NY Next Generation Math NY-8.F.1
The Standard
Understand that a function is a rule that assigns to each input exactly one output. The graph of a function is the set of ordered pairs consisting of an input and the corresponding output.
New York State Next Generation Mathematics Learning Standards
Teacher's field guide
What This Standard Means
What Students Need to Do
- Students decide whether a rule assigns exactly one output to every input. They connect that rule to tables, mapping diagrams, ordered pairs, and graphs.
What Mastery Looks Like
- A student recognizes that repeated outputs are allowed but one input cannot have two different outputs. On a graph, the student checks that each x-value appears with only one y-value.
Common Misconceptions
- Students may think repeated y-values make a relation fail or overlook one input paired with two outputs. They may also treat every plotted collection as a function.
How to Assess It
- Give students {(1, 4), (2, 4), (3, 5)} and {(1, 4), (1, 5), (2, 6)}. Ask which relation is a function and why.
Lesson moves
Ways to Teach It
Use input and output cards to build a human mapping diagram, then test whether each input student points to one output.
Ask students whether two inputs can share one output and still make a function, requiring an example in the explanation.
Play a sorting game with relation cards shown as tables, graphs, and ordered pairs, placing each under function or not a function.
Match each hour of a school day to the classroom temperature, then explain why time acts as the input.
Free download
Printable NY-8.F.1 Worksheet
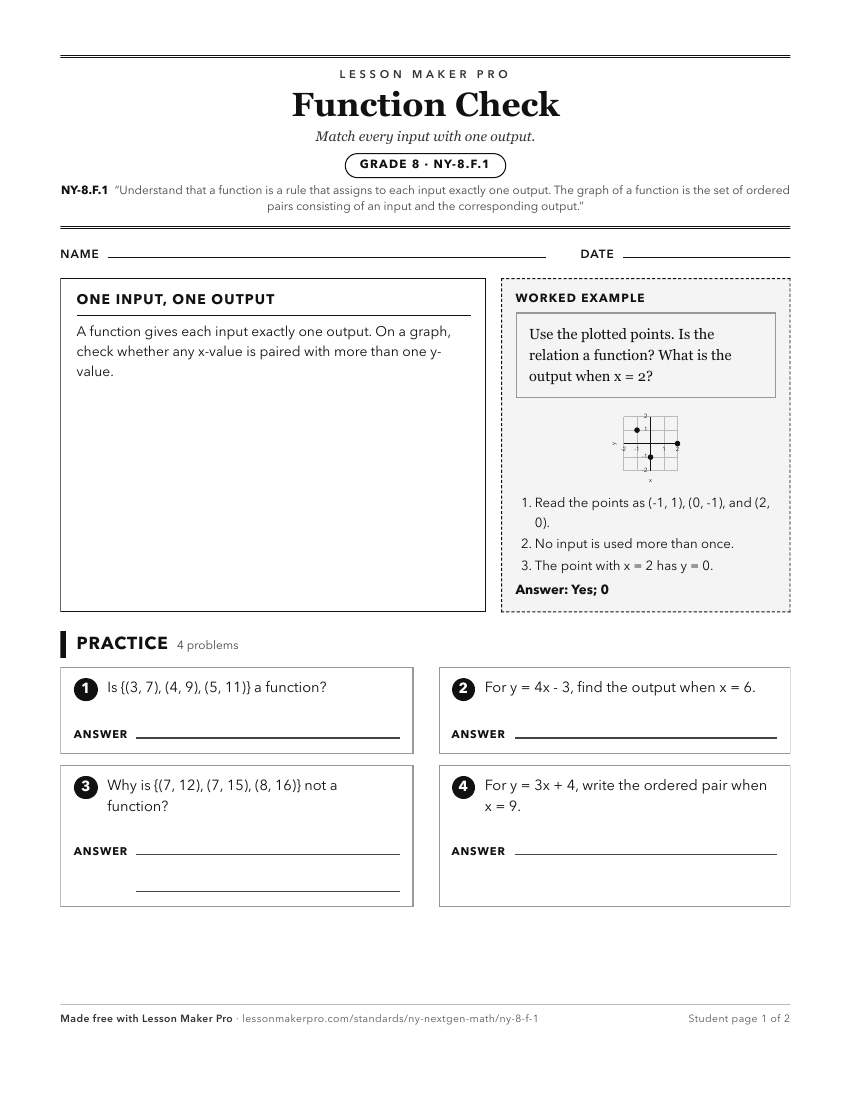
A ready-to-print activity worksheet aligned to NY-8.F.1, with an answer key for the teacher on its own page. No account needed.
PDF, US Letter, prints cleanly in black and white.
Download the worksheetKeep exploring
Related Standards
- NY-8.F.5
Describe qualitatively the functional relationship between two quantities by analyzing a graph. Sketch a graph that exhibits the qualitative features of a funct...
- NY-8.F.3
Interpret the equation y = mx + b as defining a linear function, whose graph is a straight line. Recognize examples of functions that are linear and non-linear.
- NY-8.F.2
Compare properties of two functions each represented in a different way (algebraically, graphically, numerically in tables, or by verbal descriptions).
Turn this exact standard into a lesson
Grade, subject, topic, and the complete standard are prefilled. Create one free, no account needed.
Also for this standard:Make a WorksheetMake a QuizMake a Sub Lesson