NGSS 3-ESS2-1
The Standard
Represent data in tables and graphical displays to describe typical weather conditions expected during a particular season.
Next Generation Science Standards
Teacher's field guide
What This Standard Means
What Students Need to Do
- Students organize seasonal weather measurements in tables, pictographs, and bar graphs. They read those displays to explain weather patterns people can usually expect during a season.
What Mastery Looks Like
- Students make an accurate table, pictograph, or bar graph with a title, labels, and a consistent scale or key. They use the graph to describe likely temperature, precipitation, or wind patterns for a season.
Common Misconceptions
- Students may treat one unusual day as proof of what a whole season is like. They may omit graph titles, labels, scales, or pictograph keys. Some confuse wind direction with wind speed or rainfall totals.
How to Assess It
- Give students a table of average winter temperature and precipitation for three months. Ask them to make one labeled bar graph and write one sentence describing the pattern.
Lesson moves
Ways to Teach It
Build cube towers for monthly rainfall totals, then translate the towers into a labeled bar graph.
Show two seasonal graphs and ask, “What weather should we expect, and which data support your claim?”
Play Graph Repair: pairs fix missing titles, labels, scales, or pictograph keys on prepared weather graphs.
Use a local weather website’s monthly averages to plan clothing and outdoor activities for one season.
Free download
Printable 3-ESS2-1 Worksheet
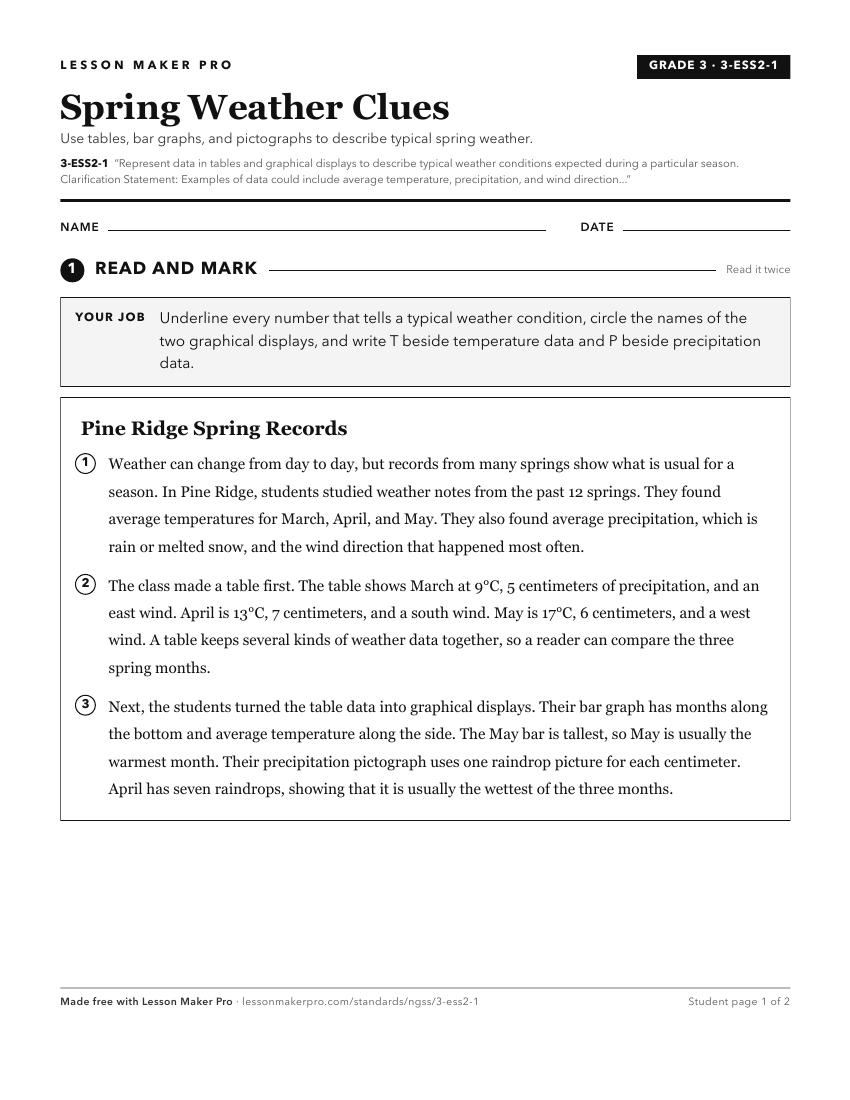
A ready-to-print activity worksheet aligned to 3-ESS2-1, with an answer key for the teacher on its own page. No account needed.
PDF, US Letter, prints cleanly in black and white.
Download the worksheetLearning progression
Where This Standard Sits
See the whole path on the Earth & Space Science progression map.
What This Unlocks
Mastery here sets students up for these next.
Keep exploring
Related Standards
- K-ESS2-1
Use and share observations of local weather conditions to describe patterns over time.
- 5-ESS1-2
Represent data in graphical displays to reveal patterns of daily changes in length and direction of shadows, day and night, and the seasonal appearance of some ...
- 3-ESS2-2
Obtain and combine information to describe climates in different regions of the world.
Turn this exact standard into a lesson
Grade, subject, topic, and the complete standard are prefilled. Create one free, no account needed.
Also for this standard:Make a WorksheetMake a QuizMake a Sub Lesson