Maryland Math 8.AT.A.2.b
The Standard
- 8.AT.A.2
- Use proportional reasoning to identify slope and represent linear relationships.
Use this relationship to write equations of lines in the form y = mx for lines that pass through the origin, and in the form y = mx + b for lines that include a vertical shift from the origin, where b represents the y-intercept.
Maryland College and Career Ready Standards for Mathematics (2025) · USE PROPORTIONAL RELATIONSHIPS TO REPRESENT AND REASON ABOUT LINEAR EQUATIONS.
Teacher's field guide
What This Standard Means
What Students Need to Do
- Students find the slope and y-intercept from a graph, table, or situation. They write y = mx for lines through the origin and y = mx + b for lines that start elsewhere.
What Mastery Looks Like
- Given points (0, -1) and (3, 5), a student writes y = 2x - 1 and checks both points. They explain that 2 is the change per x-unit and -1 is the value when x = 0.
Common Misconceptions
- Students may use the x-intercept for b or divide the run by the rise to find the slope. Some assume every line starts at zero or mistake b for the change per x-unit.
How to Assess It
- Exit ticket: A line passes through (0, 3) and (2, 7). Write its equation and label its slope and y-intercept.
Lesson moves
Ways to Teach It
Place counters at (0, 2), (1, 5), and (2, 8) on graph paper; draw the line and write its equation.
Ask partners to plot y = 3x and y = 3x + 2, then explain why the lines start at different heights.
Match cards for y = 2x, y = 2x + 3, y = -x, and y = -x + 3 to four hand-drawn graphs.
A taxi charges $4 to start and $2 per mile; write its cost equation and compare it with a taxi that has no starting fee.
Free download
Printable 8.AT.A.2.b Worksheet
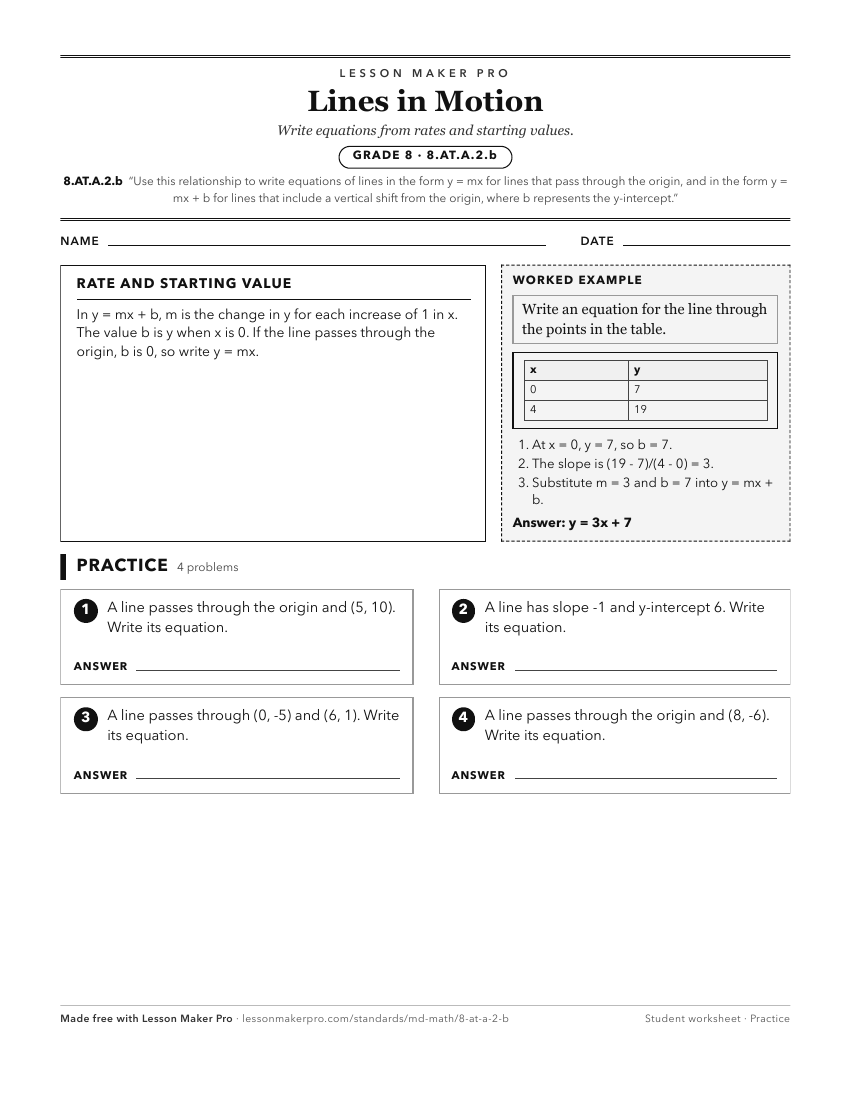
A ready-to-print activity worksheet aligned to 8.AT.A.2.b, with an answer key for the teacher on its own page. No account needed.
PDF, US Letter, prints cleanly in black and white.
Download the worksheetKeep exploring
Related Standards
- 8.AT.D.9
Interpret the graph of a linear function in the form y = mx + b
- 8.AT.D.9.a
Given the graph of a linear function, identify the slope and y-intercept.
- 8.DS.B.4
Use a provided linear model to make predictions based on bivariate measurement data. Interpret the meaning of the slope and y-intercept in context.
- 8.AT.D.9.b
Match a linear equation in the form y = mx + b to its graph.
Turn this exact standard into a lesson
Grade, subject, topic, and the complete standard are prefilled. Create one free, no account needed.
Also for this standard:Make a WorksheetMake a QuizMake a Sub Lesson